8 Analysis of GSEA results
library(ggkegg)
library(ggfx)
library(ggraph)
library(igraph)
library(clusterProfiler)
library(dplyr)
library(tidygraph)
library(org.Hs.eg.db)
8.1 Visualize the result of enrichKEGG and gseKEGG
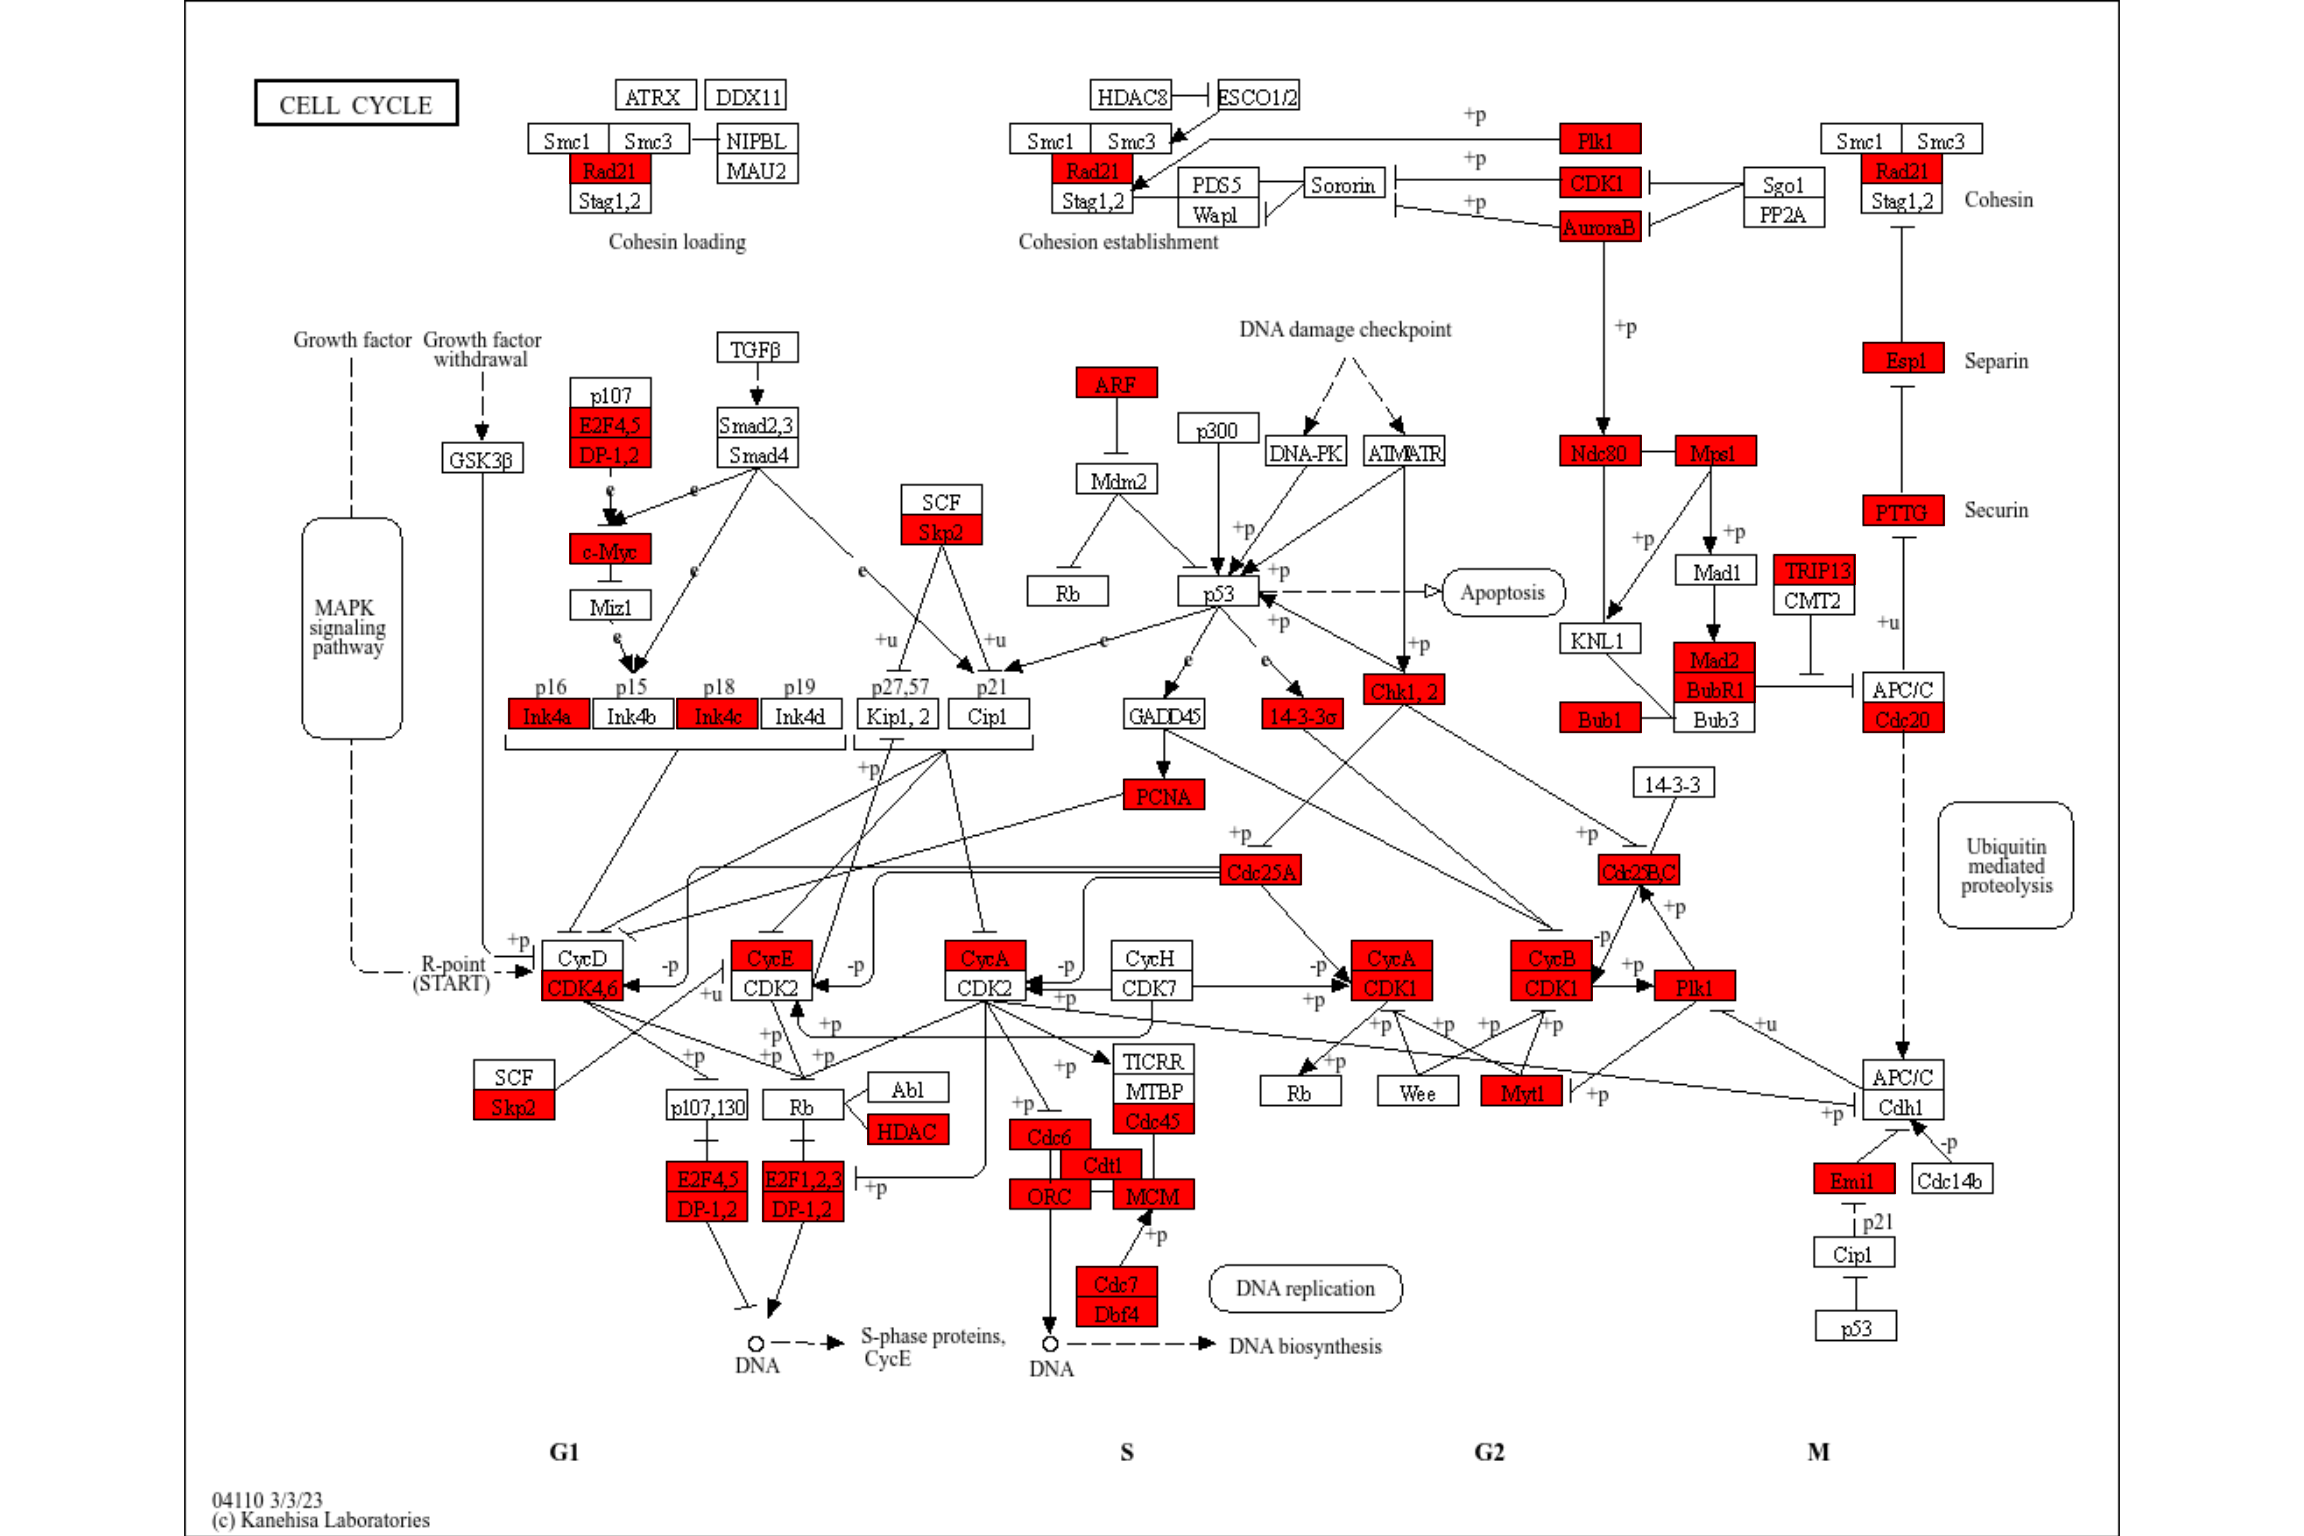
The library can directly visualize the functional enrichment analysis result using enrichKEGG from clusterProfiler. The enrich_attribute will have boolean value whether the investigated gene is in pathway or not. By piping a enrichResult class object and pathway_number to ggkegg, enrich_attribute will be included in the resulting graph. Highlight enrich_attribute in the resulting graph. For a quick inspection, rawMap function can be used for simply producing highlighted graph with overlaid KEGG raw map.
data(geneList, package='DOSE')
de <- names(geneList)[1:100]
enrichKEGG(de, pvalueCutoff=0.01) |>
  ggkegg(convert_org = "hsa",
         pathway_number=1) +
    geom_edge_link(
    aes(color=subtype_name),
    arrow = arrow(length = unit(1, 'mm')),
    start_cap = square(1, 'cm'),
    end_cap = square(1.5, 'cm')) +
    geom_node_rect(aes(filter=.data$undefined & !.data$type=="gene"),
                   fill="transparent", color="red")+
    geom_node_rect(aes(filter=!.data$undefined &
                         .data$type=="gene"), fill="white", color="black")+
    geom_node_text(aes(label=converted_name,
                       filter=.data$type == "gene"),
                   size=2.5,
                   color="black",family="serif")+
    with_outer_glow(geom_node_text(aes(label=converted_name,
                                       filter=.data$enrich_attribute),
                                   size=2.5, color="red"),
                    colour="white",
                    expand=4)+
    theme_void()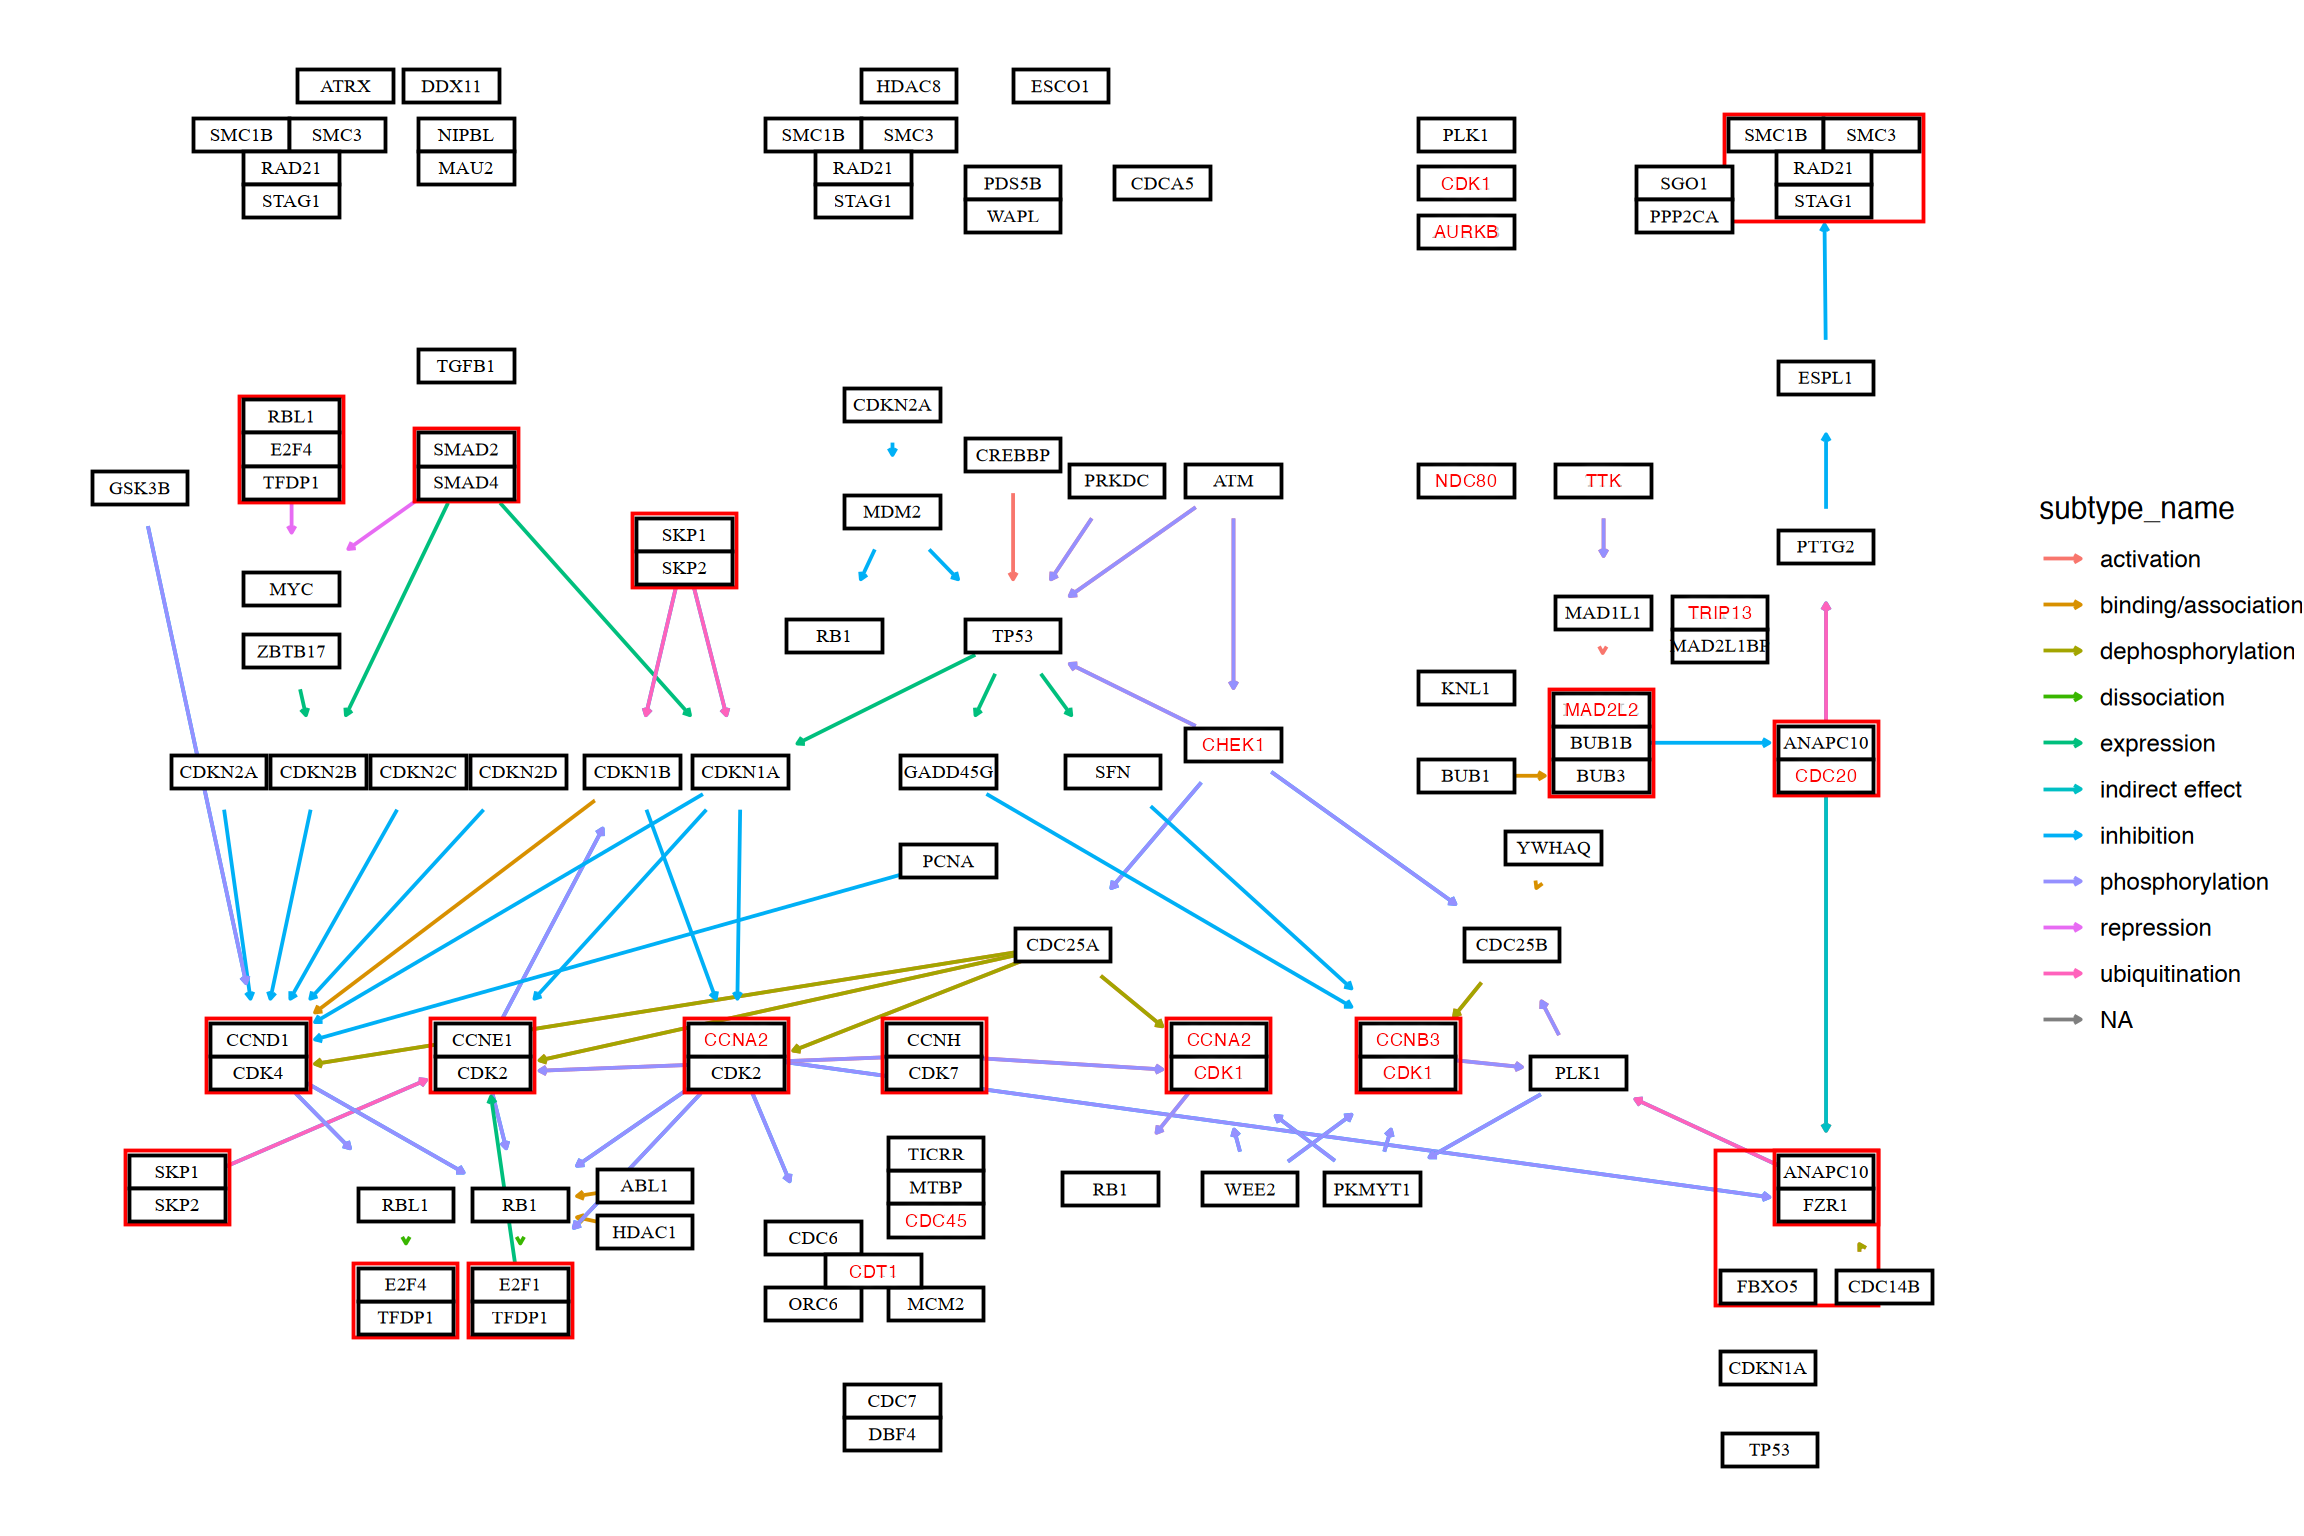
## Quick inspection
res <- enrichKEGG(de, pvalueCutoff=0.01) |> rawMap()
res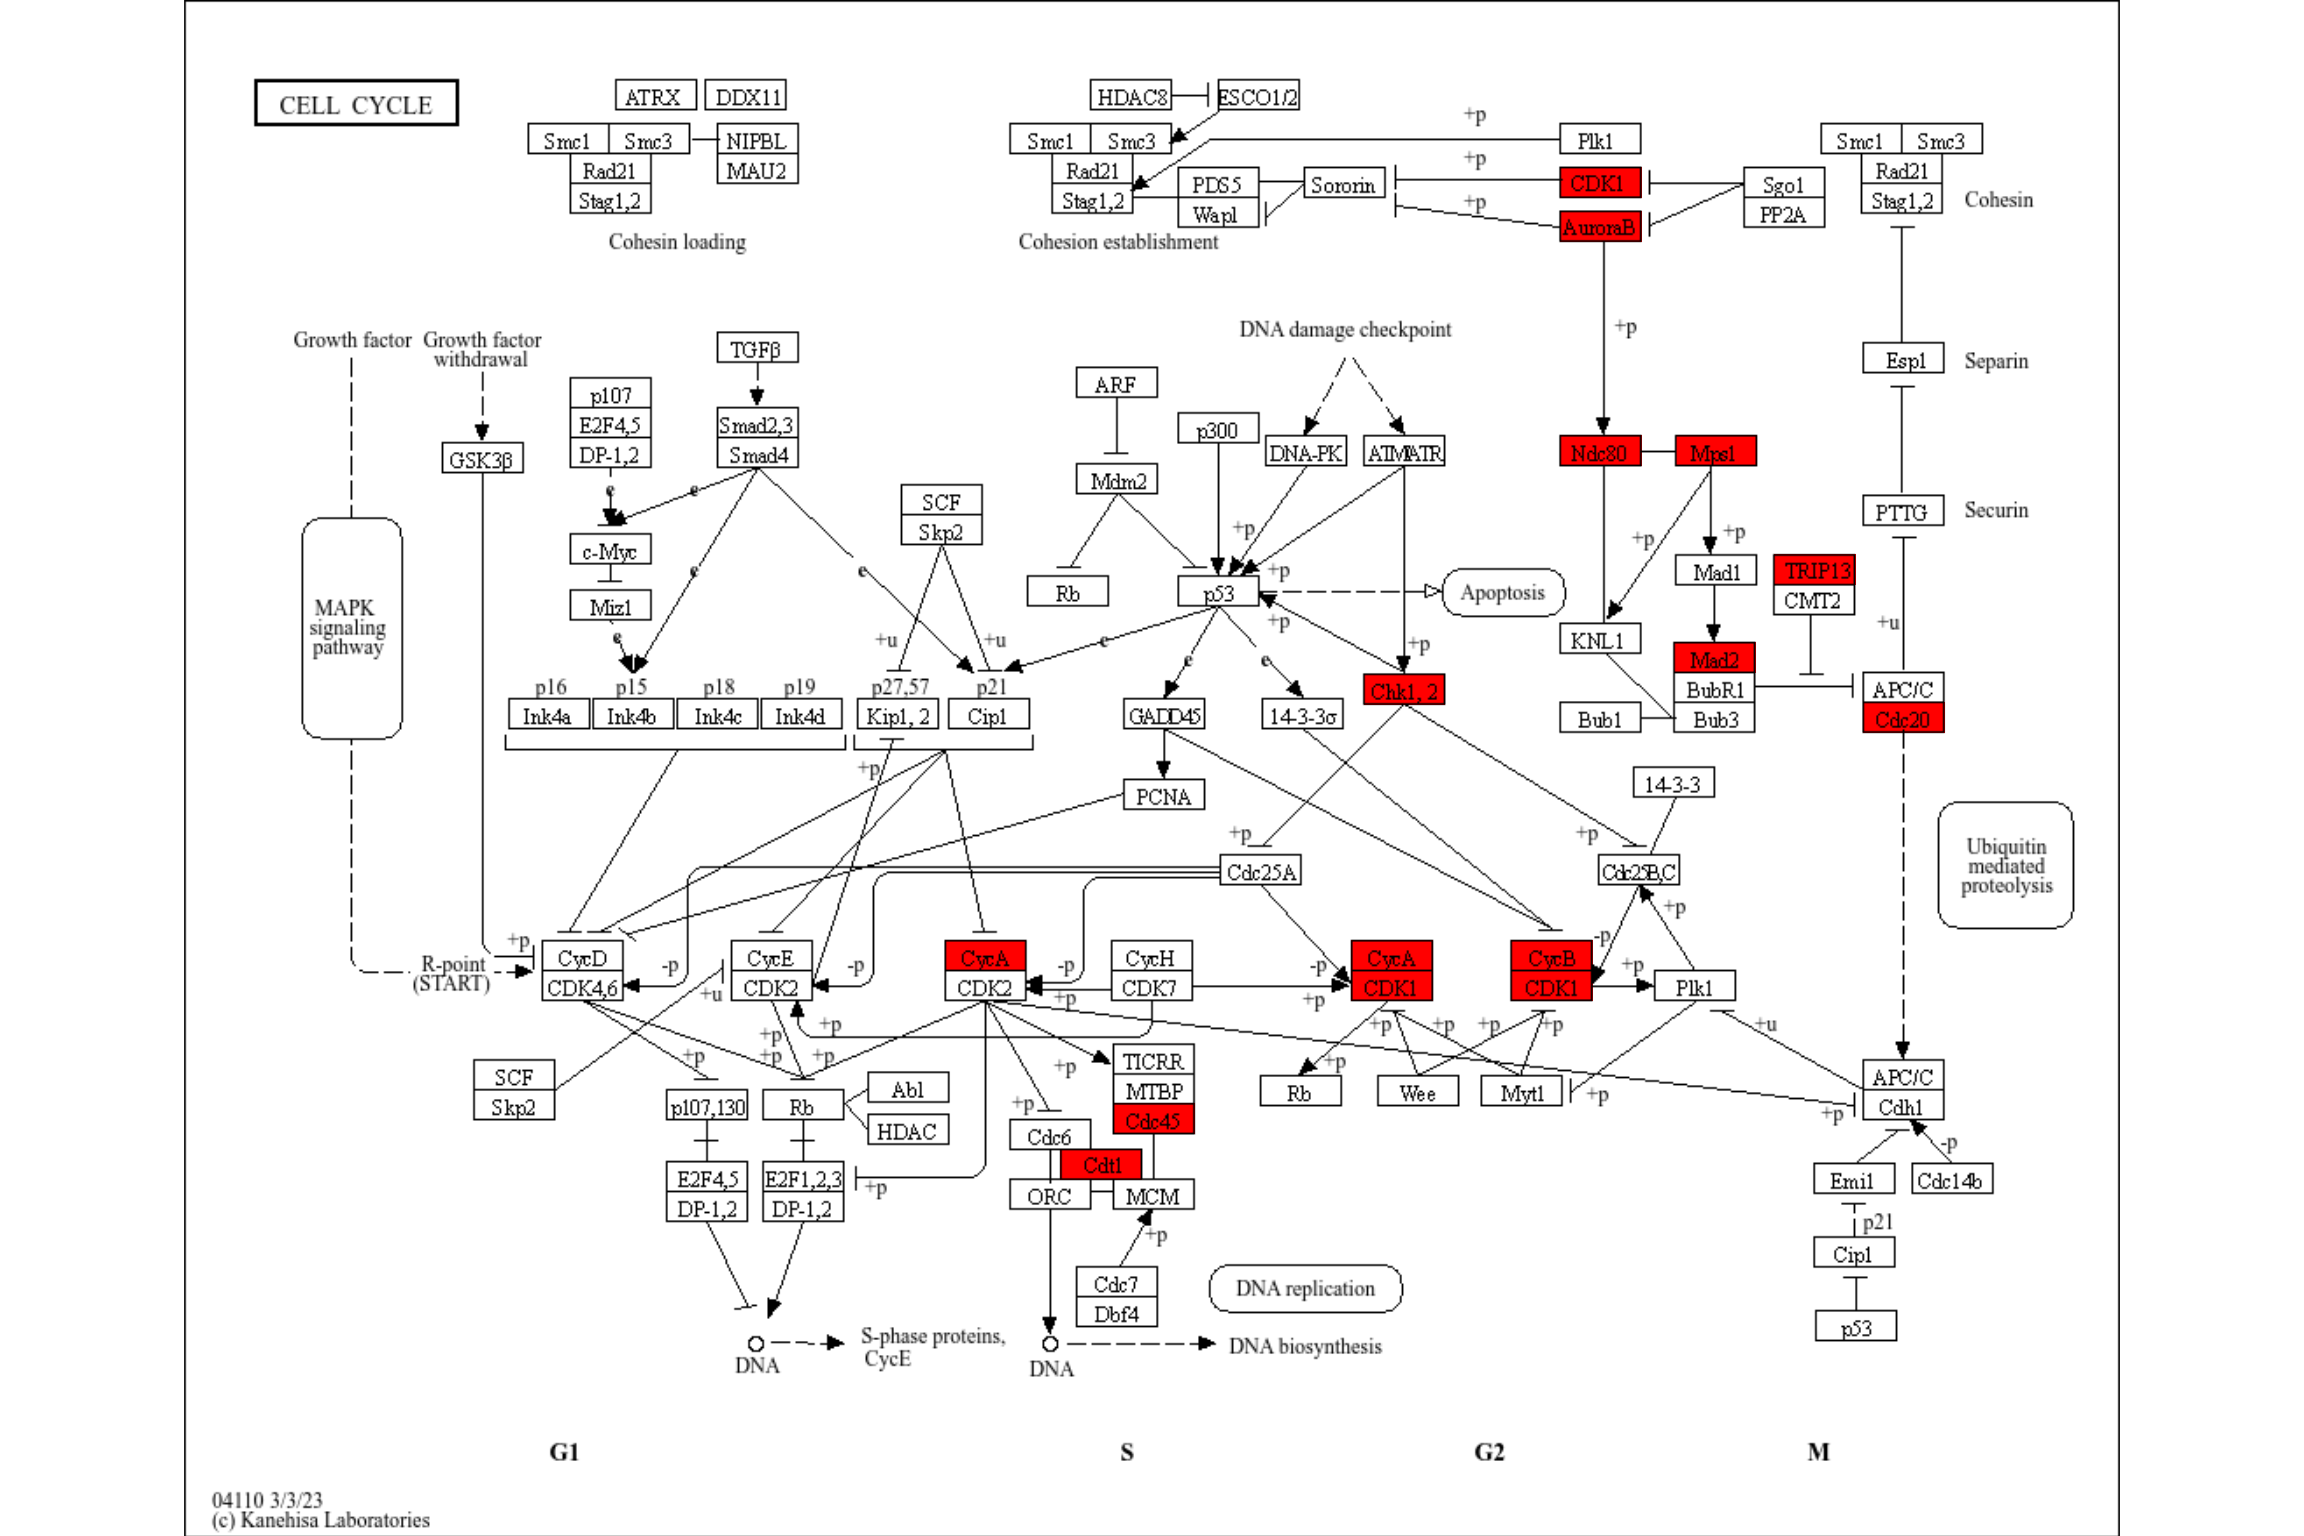
rawMap can accept multiple enrichResult class objects, given by list. In this case, users can choose which color to highlight the components in the list by specifying multiple colors in fill_color. Also, you should specify pathway ID for multiple enrichment results.
deres <- enrichKEGG(de, pvalueCutoff=0.01)
res <- rawMap(list(deres, deres, deres), fill_color=c("red","green","blue"), pid="hsa04110")
res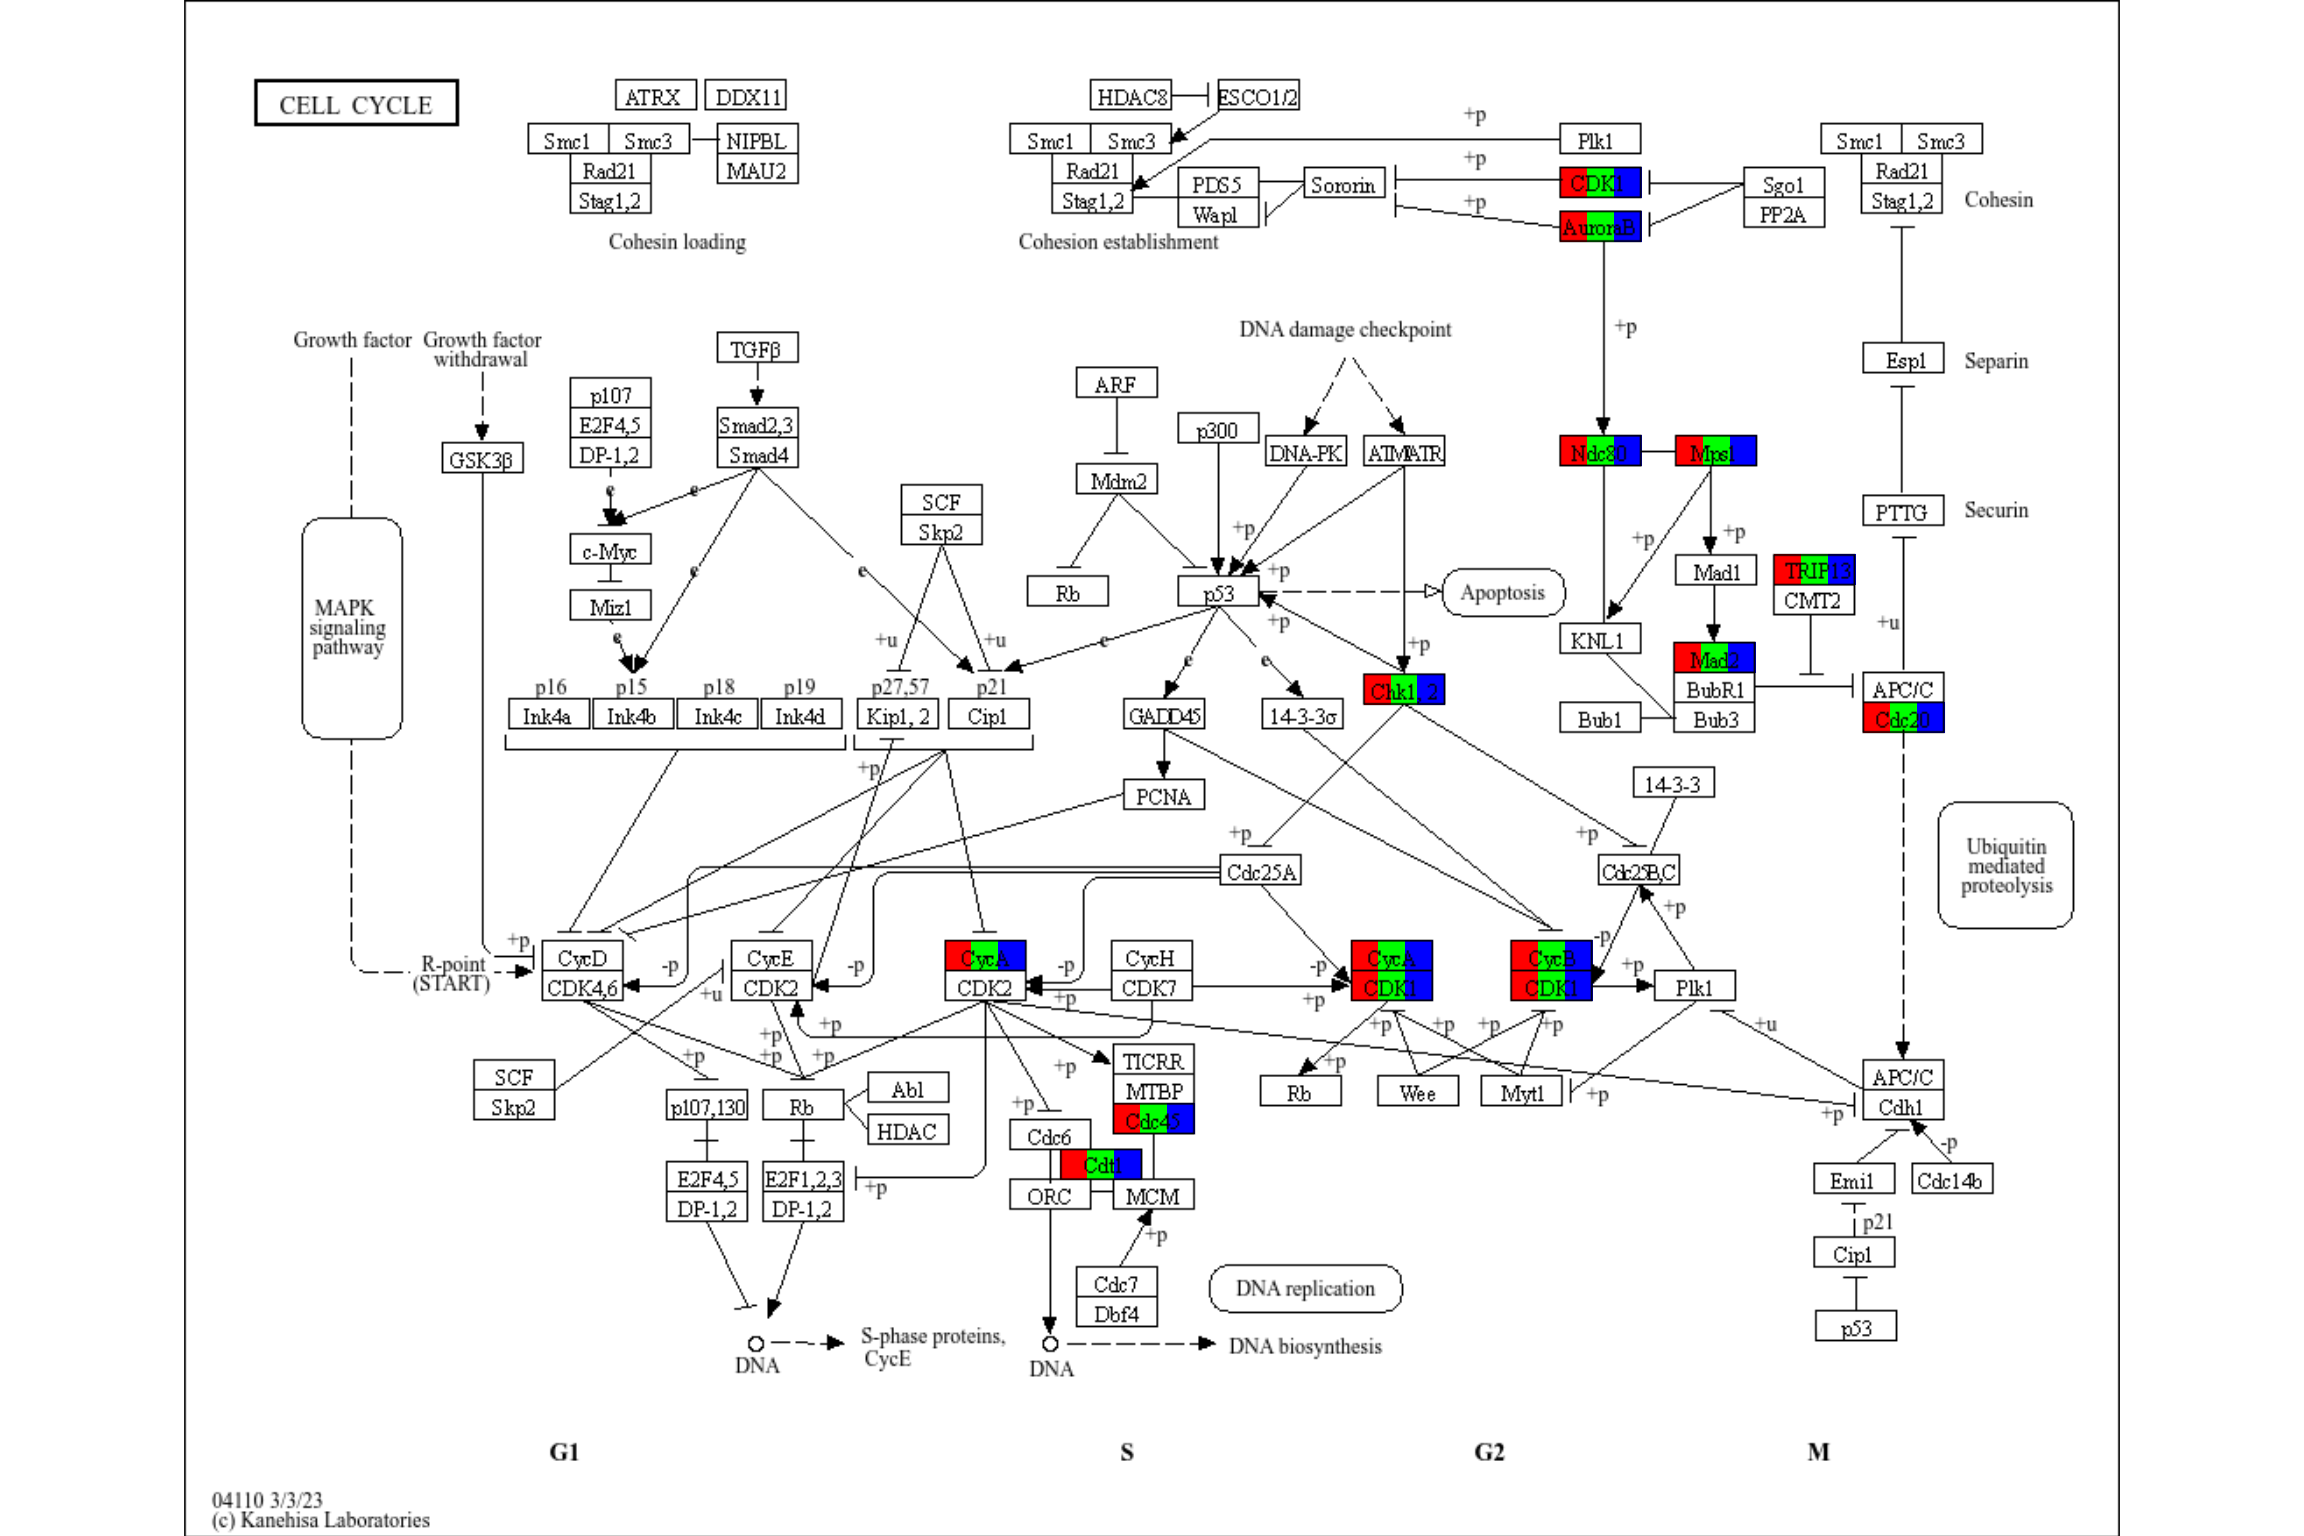
If the results are converted to readable format, you can specify name argument to the column name in node data.
deres <- enrichKEGG(de, pvalueCutoff=0.01)
deres <- setReadable(deres, org.Hs.eg.db, "ENTREZID")
res <- rawMap(list(deres, deres, deres), fill_color=c("red","green","blue"), pid="hsa04110", name="graphics_name", sep=", ")
res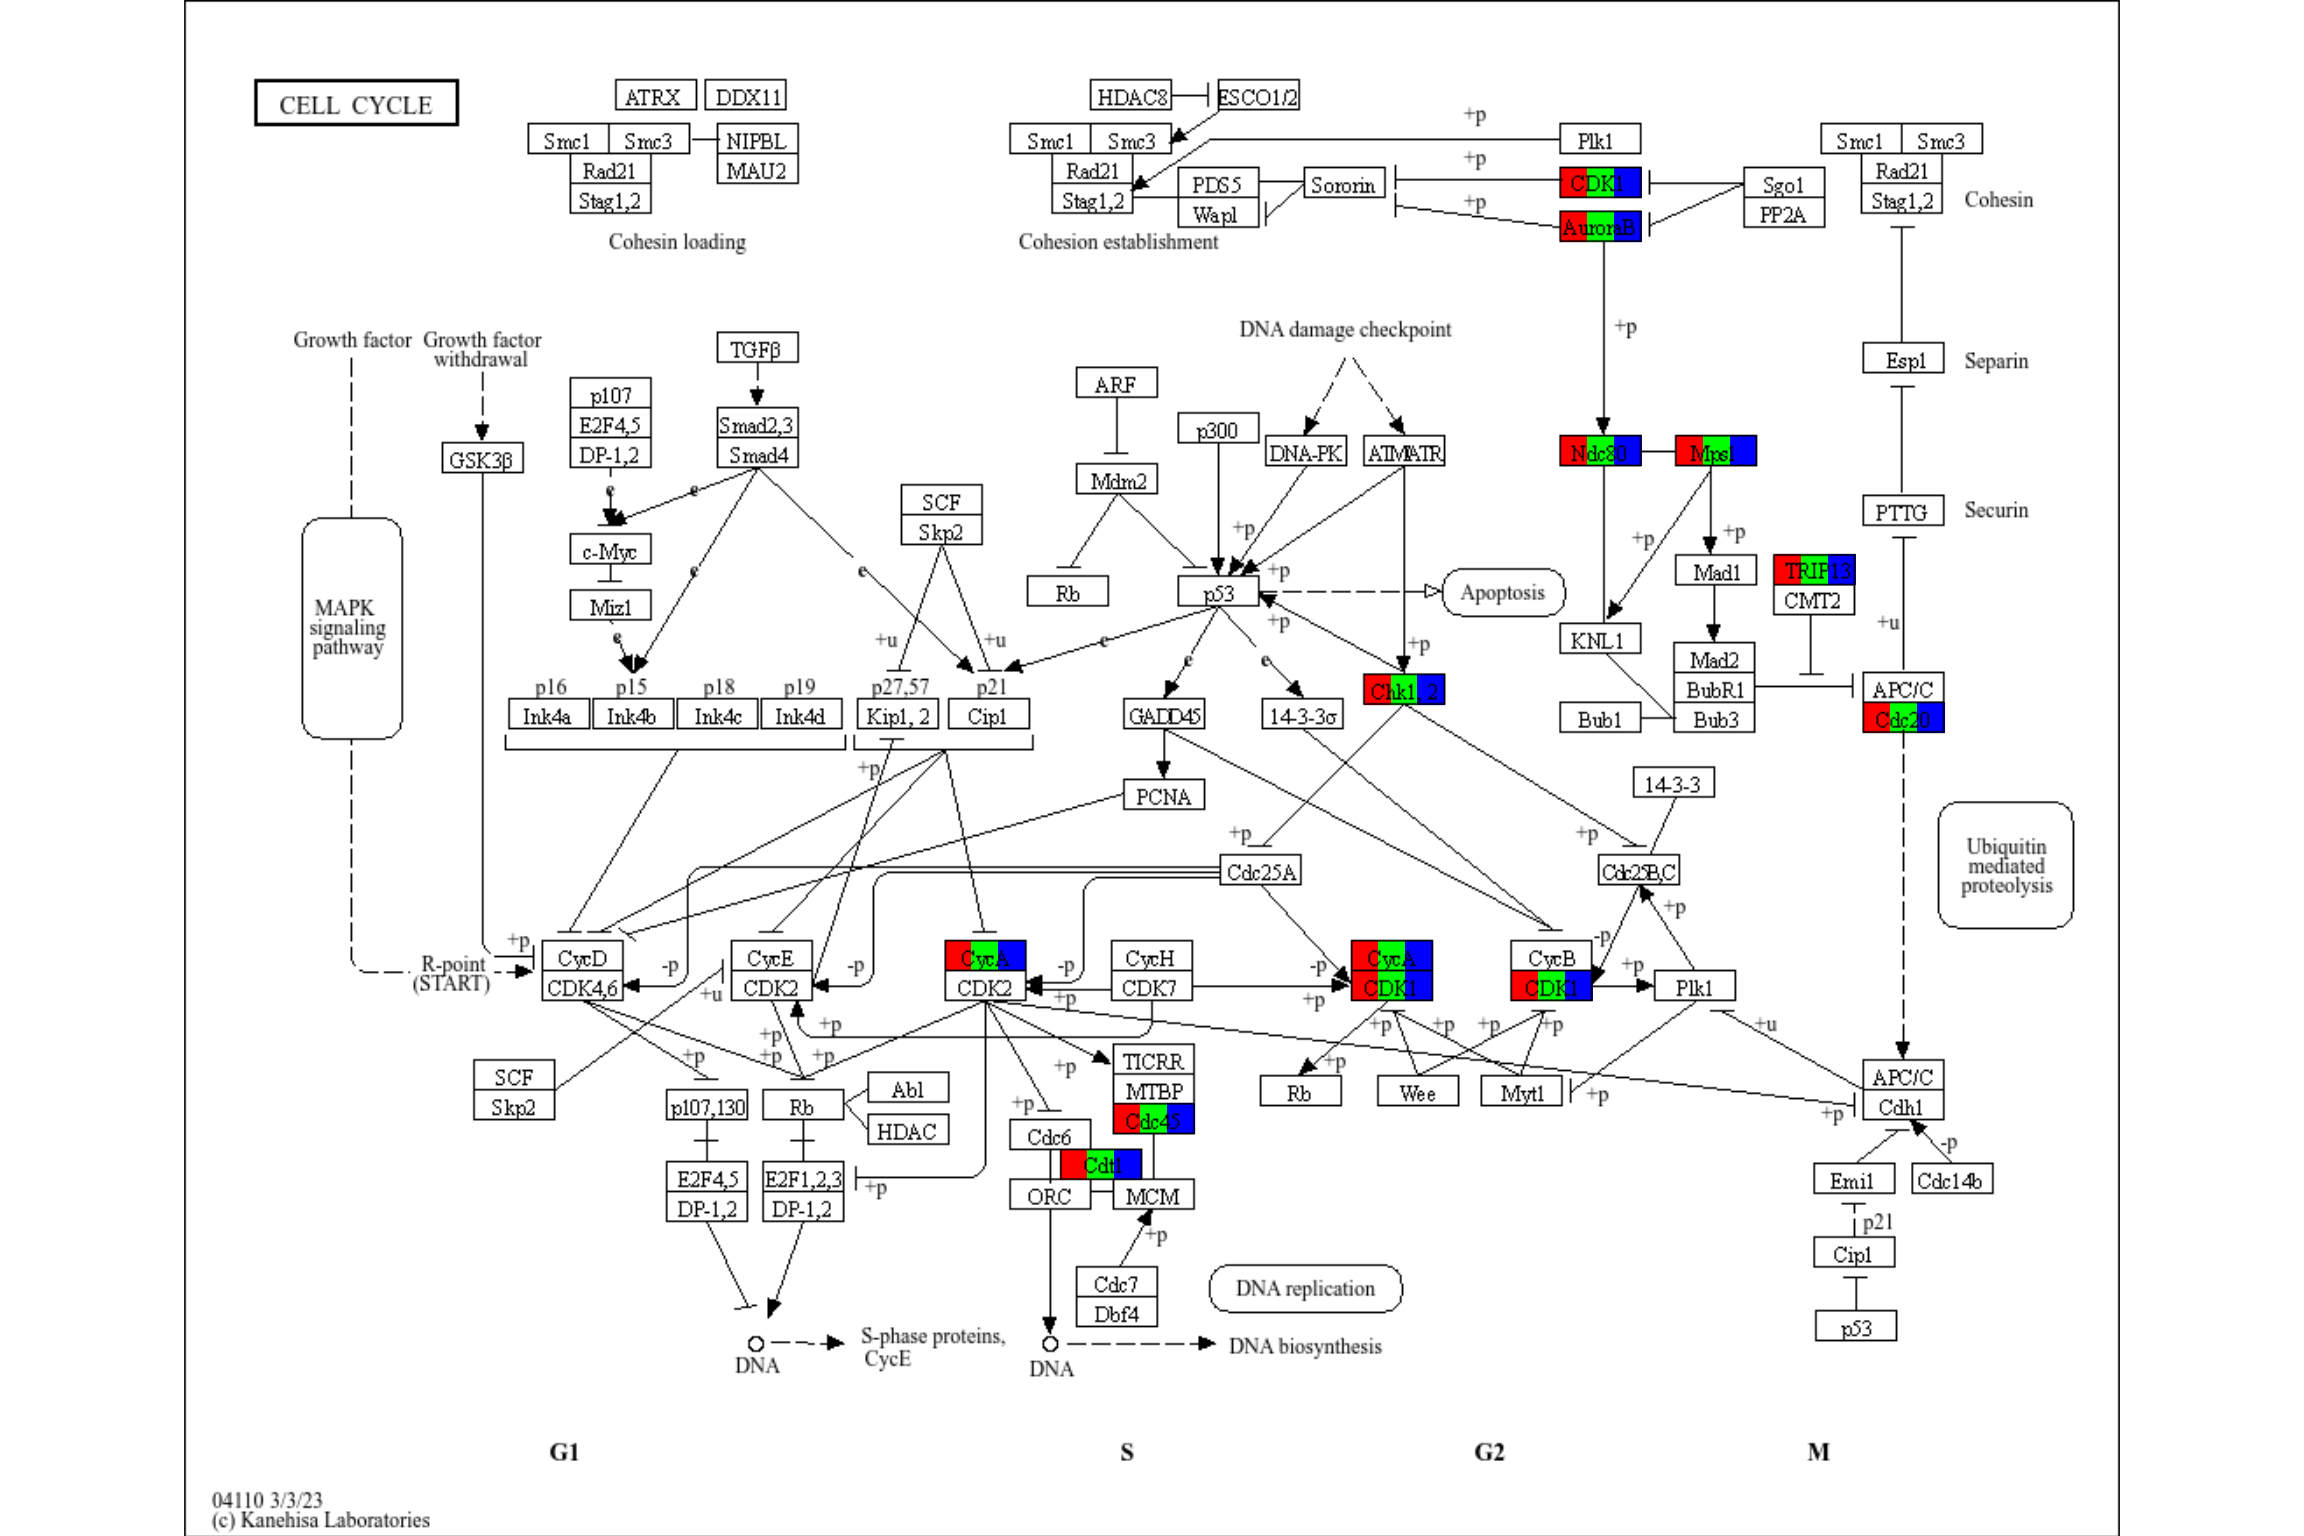
rawMap also accepts gseaResult class, although it may be useful for assigning numeric values such as log2 fold changes directly.
The same can be done for the numeric values using rawValue. You can control your favorite color gradient using scale_fill_gradient*. Note if multiple named vectors were passed by a list, the same scale is used. It can be customized by adding the additional scales using the package such as ggh4x.
res <- rawValue(geneList[1:100], "hsa04110", auto_add=TRUE)
res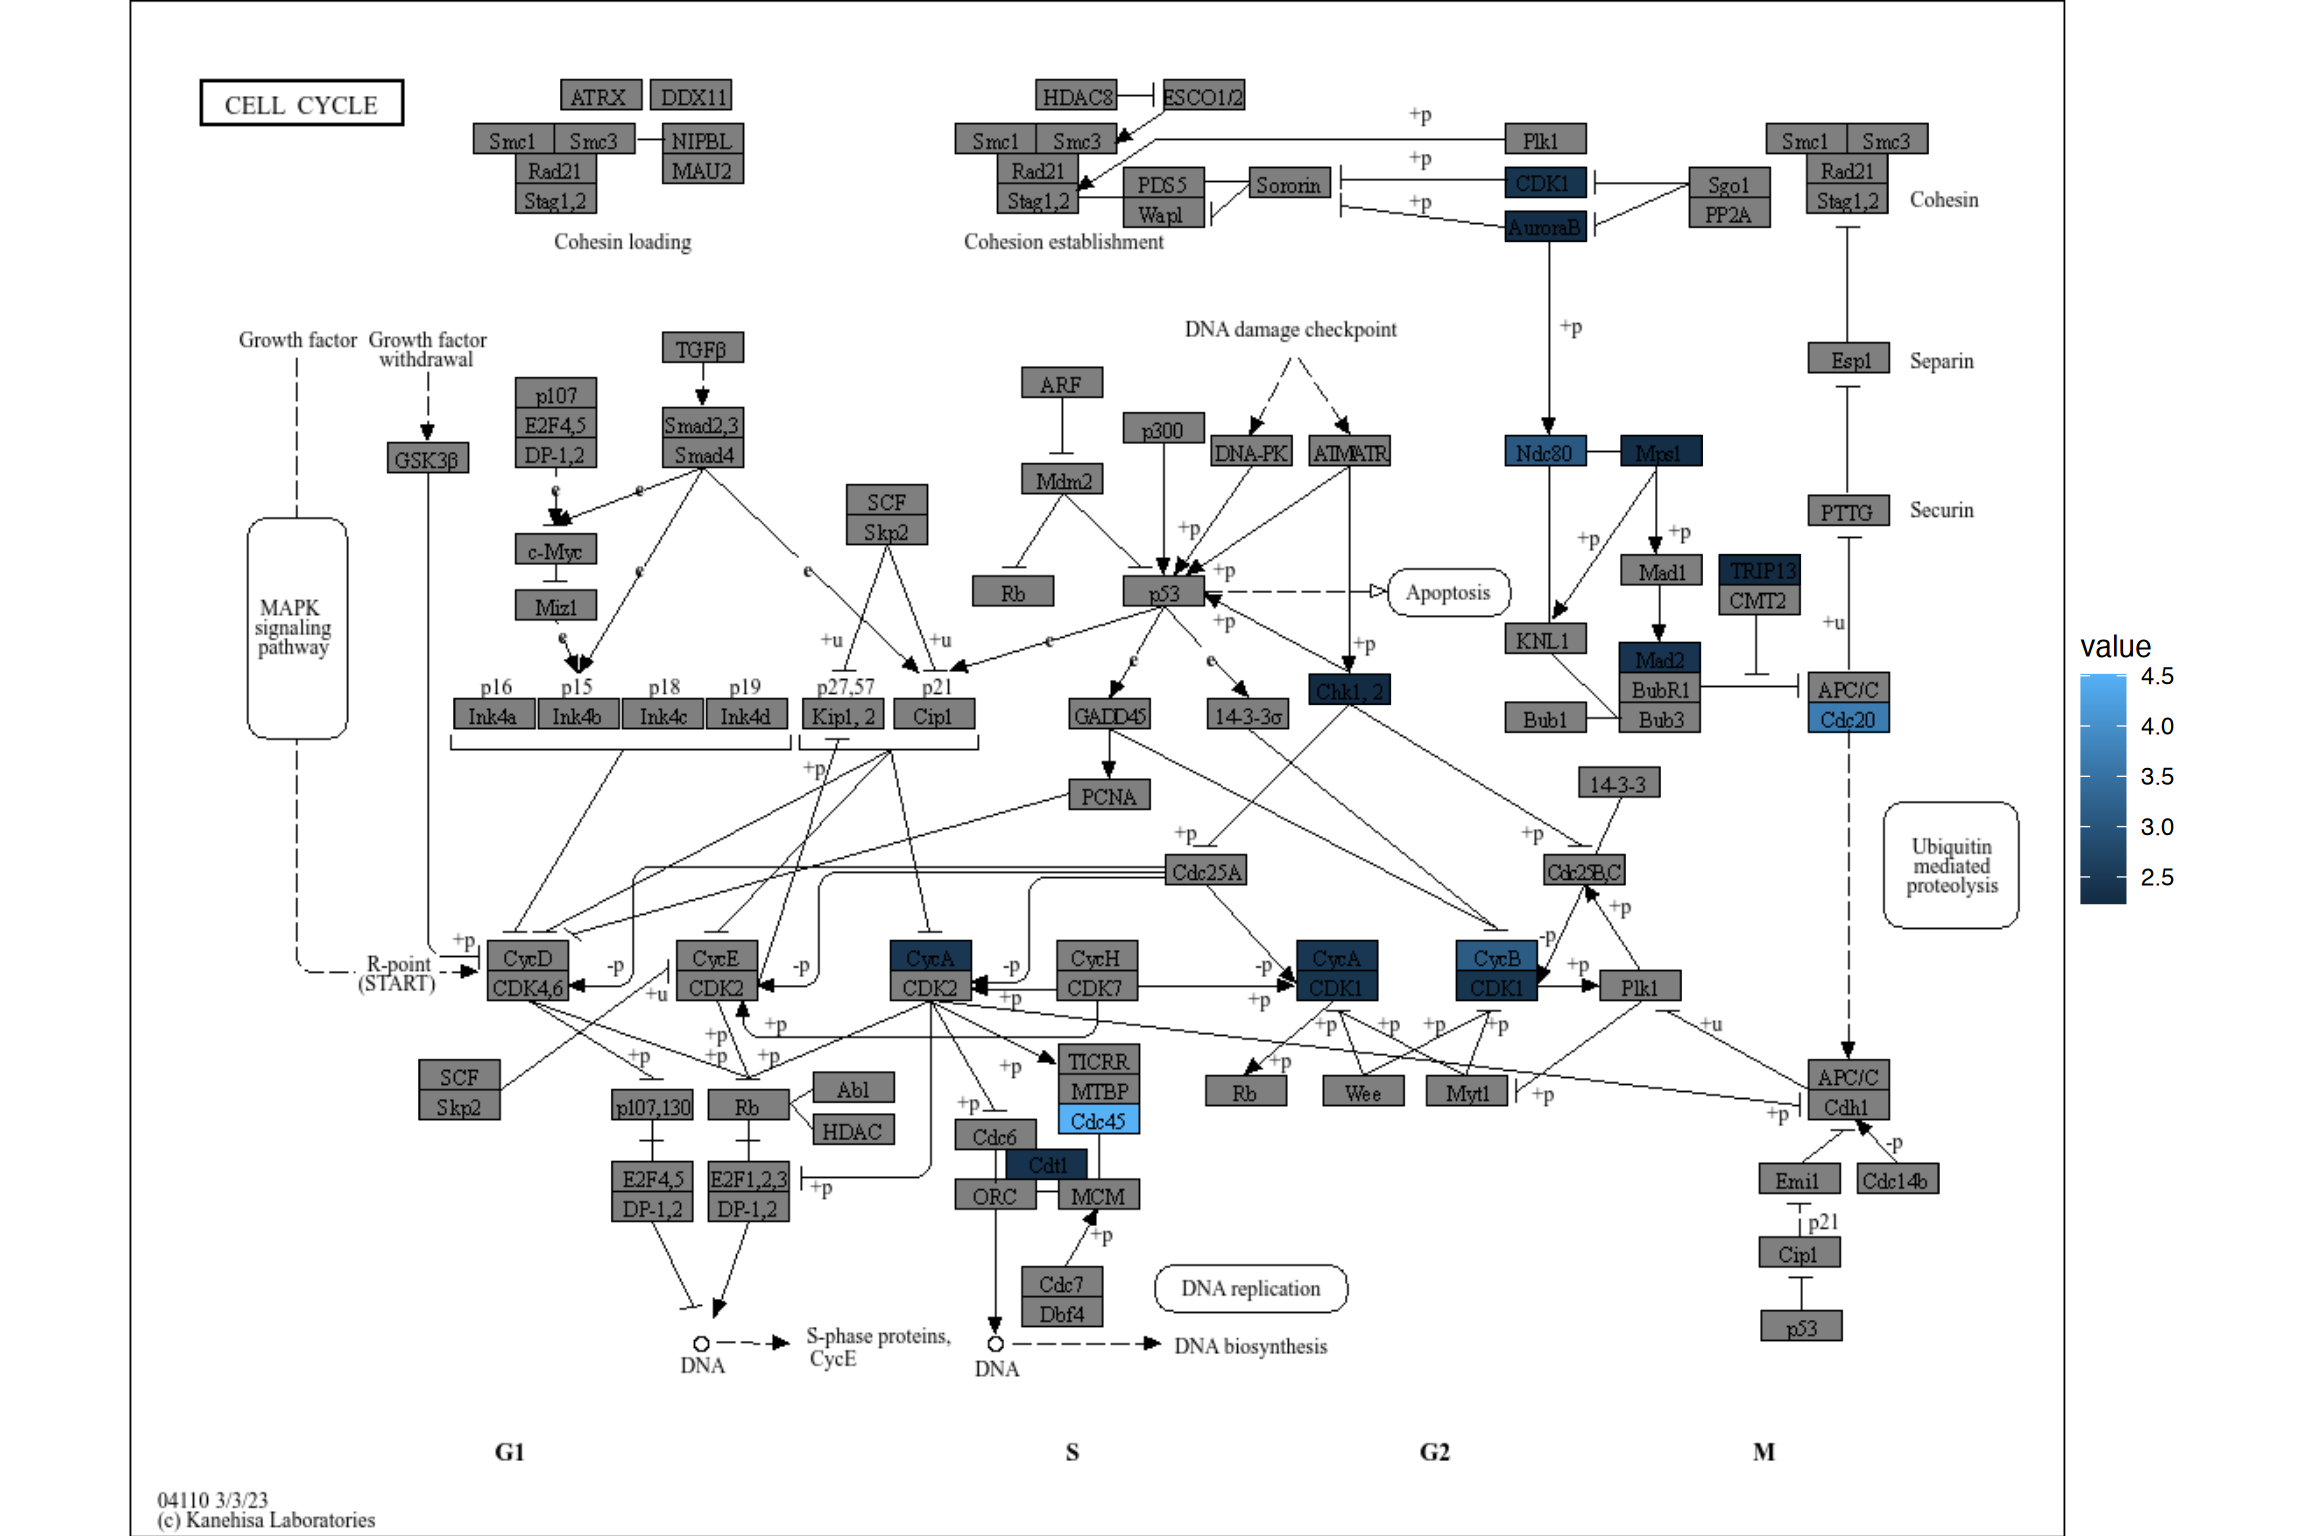
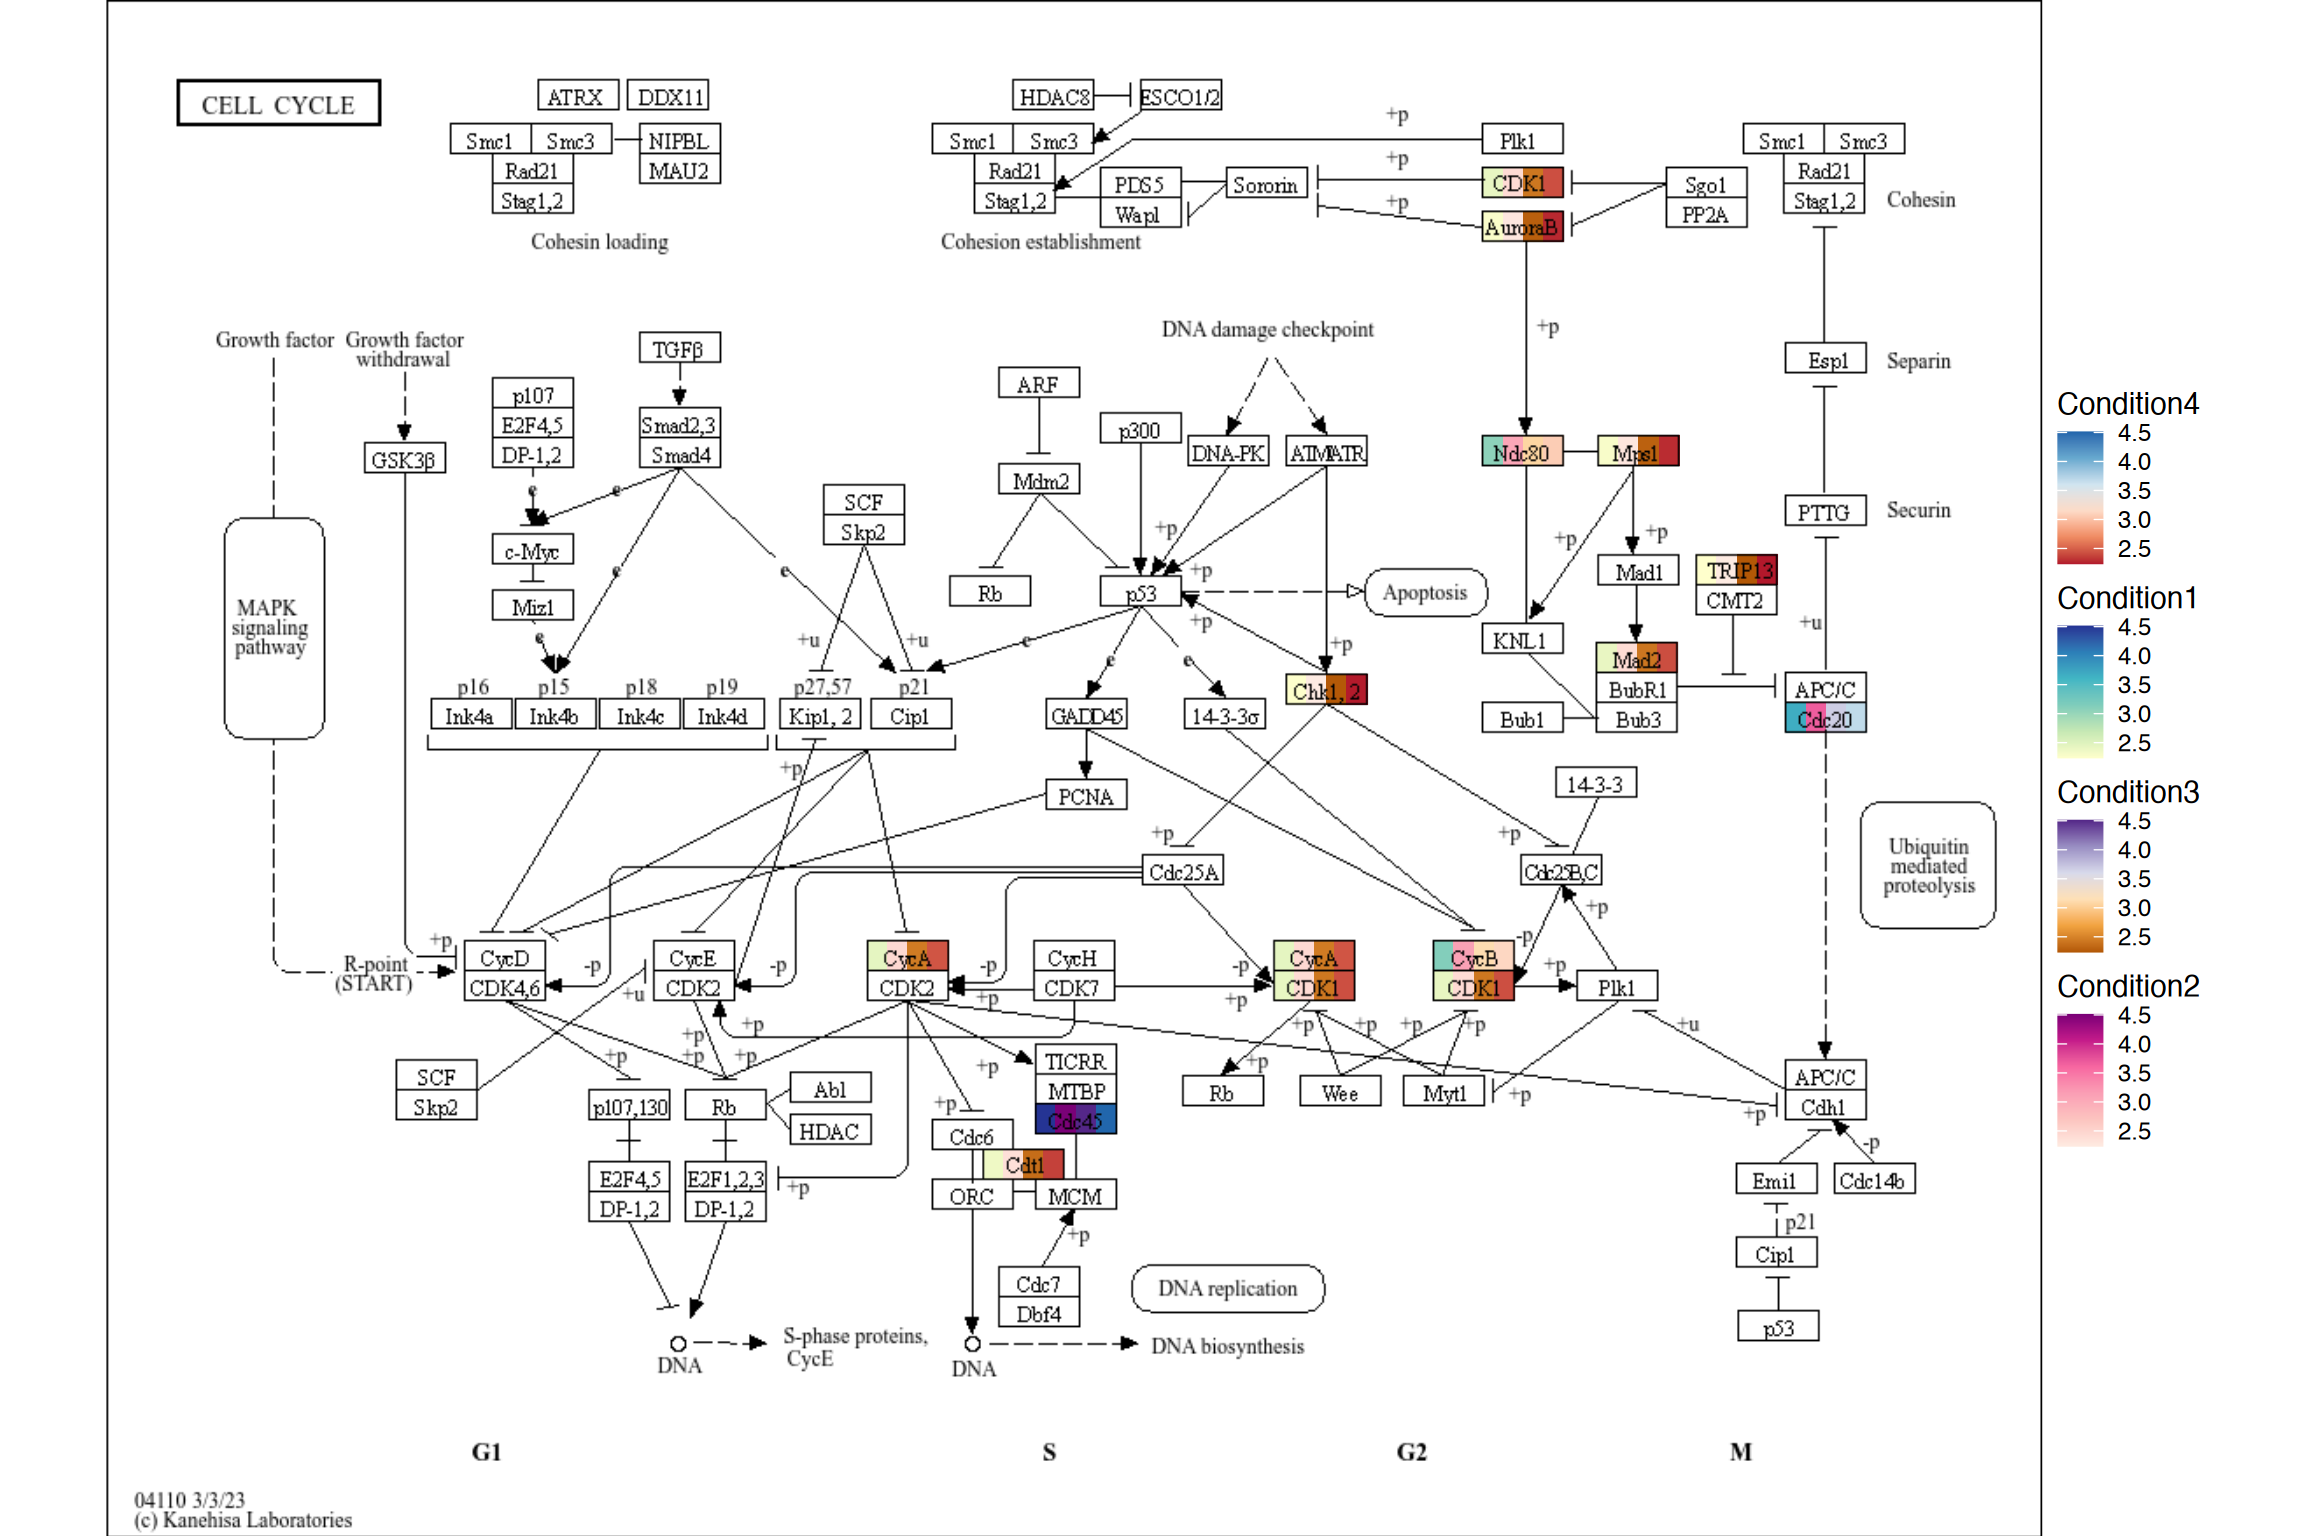
8.2 Using multiple scales when highlighting multiple values in pathway
Using ggh4x, you can plot the multiple values in its own scale using scale_fill_multi(). It is used in the package plotKEGGPathway in stana package for intra-species diversity analysis. For usage in the function, please refer to ggh4x site and the code.
library(ggh4x)
test <- geneList[1:100]
names(test) <- paste0("hsa:",names(test))
g <- pathway("hsa04110") |>
  mutate(value1=node_numeric(test),
         value2=node_numeric(test),
         value3=node_numeric(test),
         value4=node_numeric(test))
res <- ggraph(g) +
  geom_node_rect(aes(value1=value1)) +
  geom_node_rect(aes(value2=value2, xmin=xmin+width/4))+
  geom_node_rect(aes(value3=value3, xmin=xmin+2*width/4))+
  geom_node_rect(aes(value4=value4, xmin=xmin+3*width/4))+
  overlay_raw_map() + theme_void() +
  scale_fill_multi(aesthetics = c("value1", "value2",
                                  "value3", "value4"),
                   name = list("Condition1",
                               "Condition2",
                               "Condition3",
                               "Condition4"),
                   colours = list(
                     scales::brewer_pal(palette = "YlGnBu")(6),
                     scales::brewer_pal(palette = "RdPu")(6),
                     scales::brewer_pal(palette = "PuOr")(6),
                     scales::brewer_pal(palette = "RdBu")(6)
                   ),
                   guide = guide_colorbar(barheight = unit(50, "pt")))
res