Chapter 7 Testing the score inside the pathway
Test whether the dependency scores of genes within the pathway is different from overall score distribution (depKStest).
The type variable can be either cell_line or lineage.
pway <- depKStest(results = pway, type = "cell_line", cellLineName = "253J_URINARY_TRACT", adjMethod = "bonferroni", dep = dep, depMeta = depMeta)

ggplot(pway@result, aes(x=depAdjP)) +
  geom_histogram(aes(fill=..count..), col="black") +
  scale_fill_gradient("Count", low = "blue", high = "red") +
  theme_minimal(base_family = "Arial Narrow") +
  ggtitle("253J_URINARY_TRACT")+
  xlab("Adjusted p-value")+
  theme(plot.title = element_text(hjust=0.5, face="bold"),
        axis.text = element_text(size=10),
        axis.title = element_text(size=12))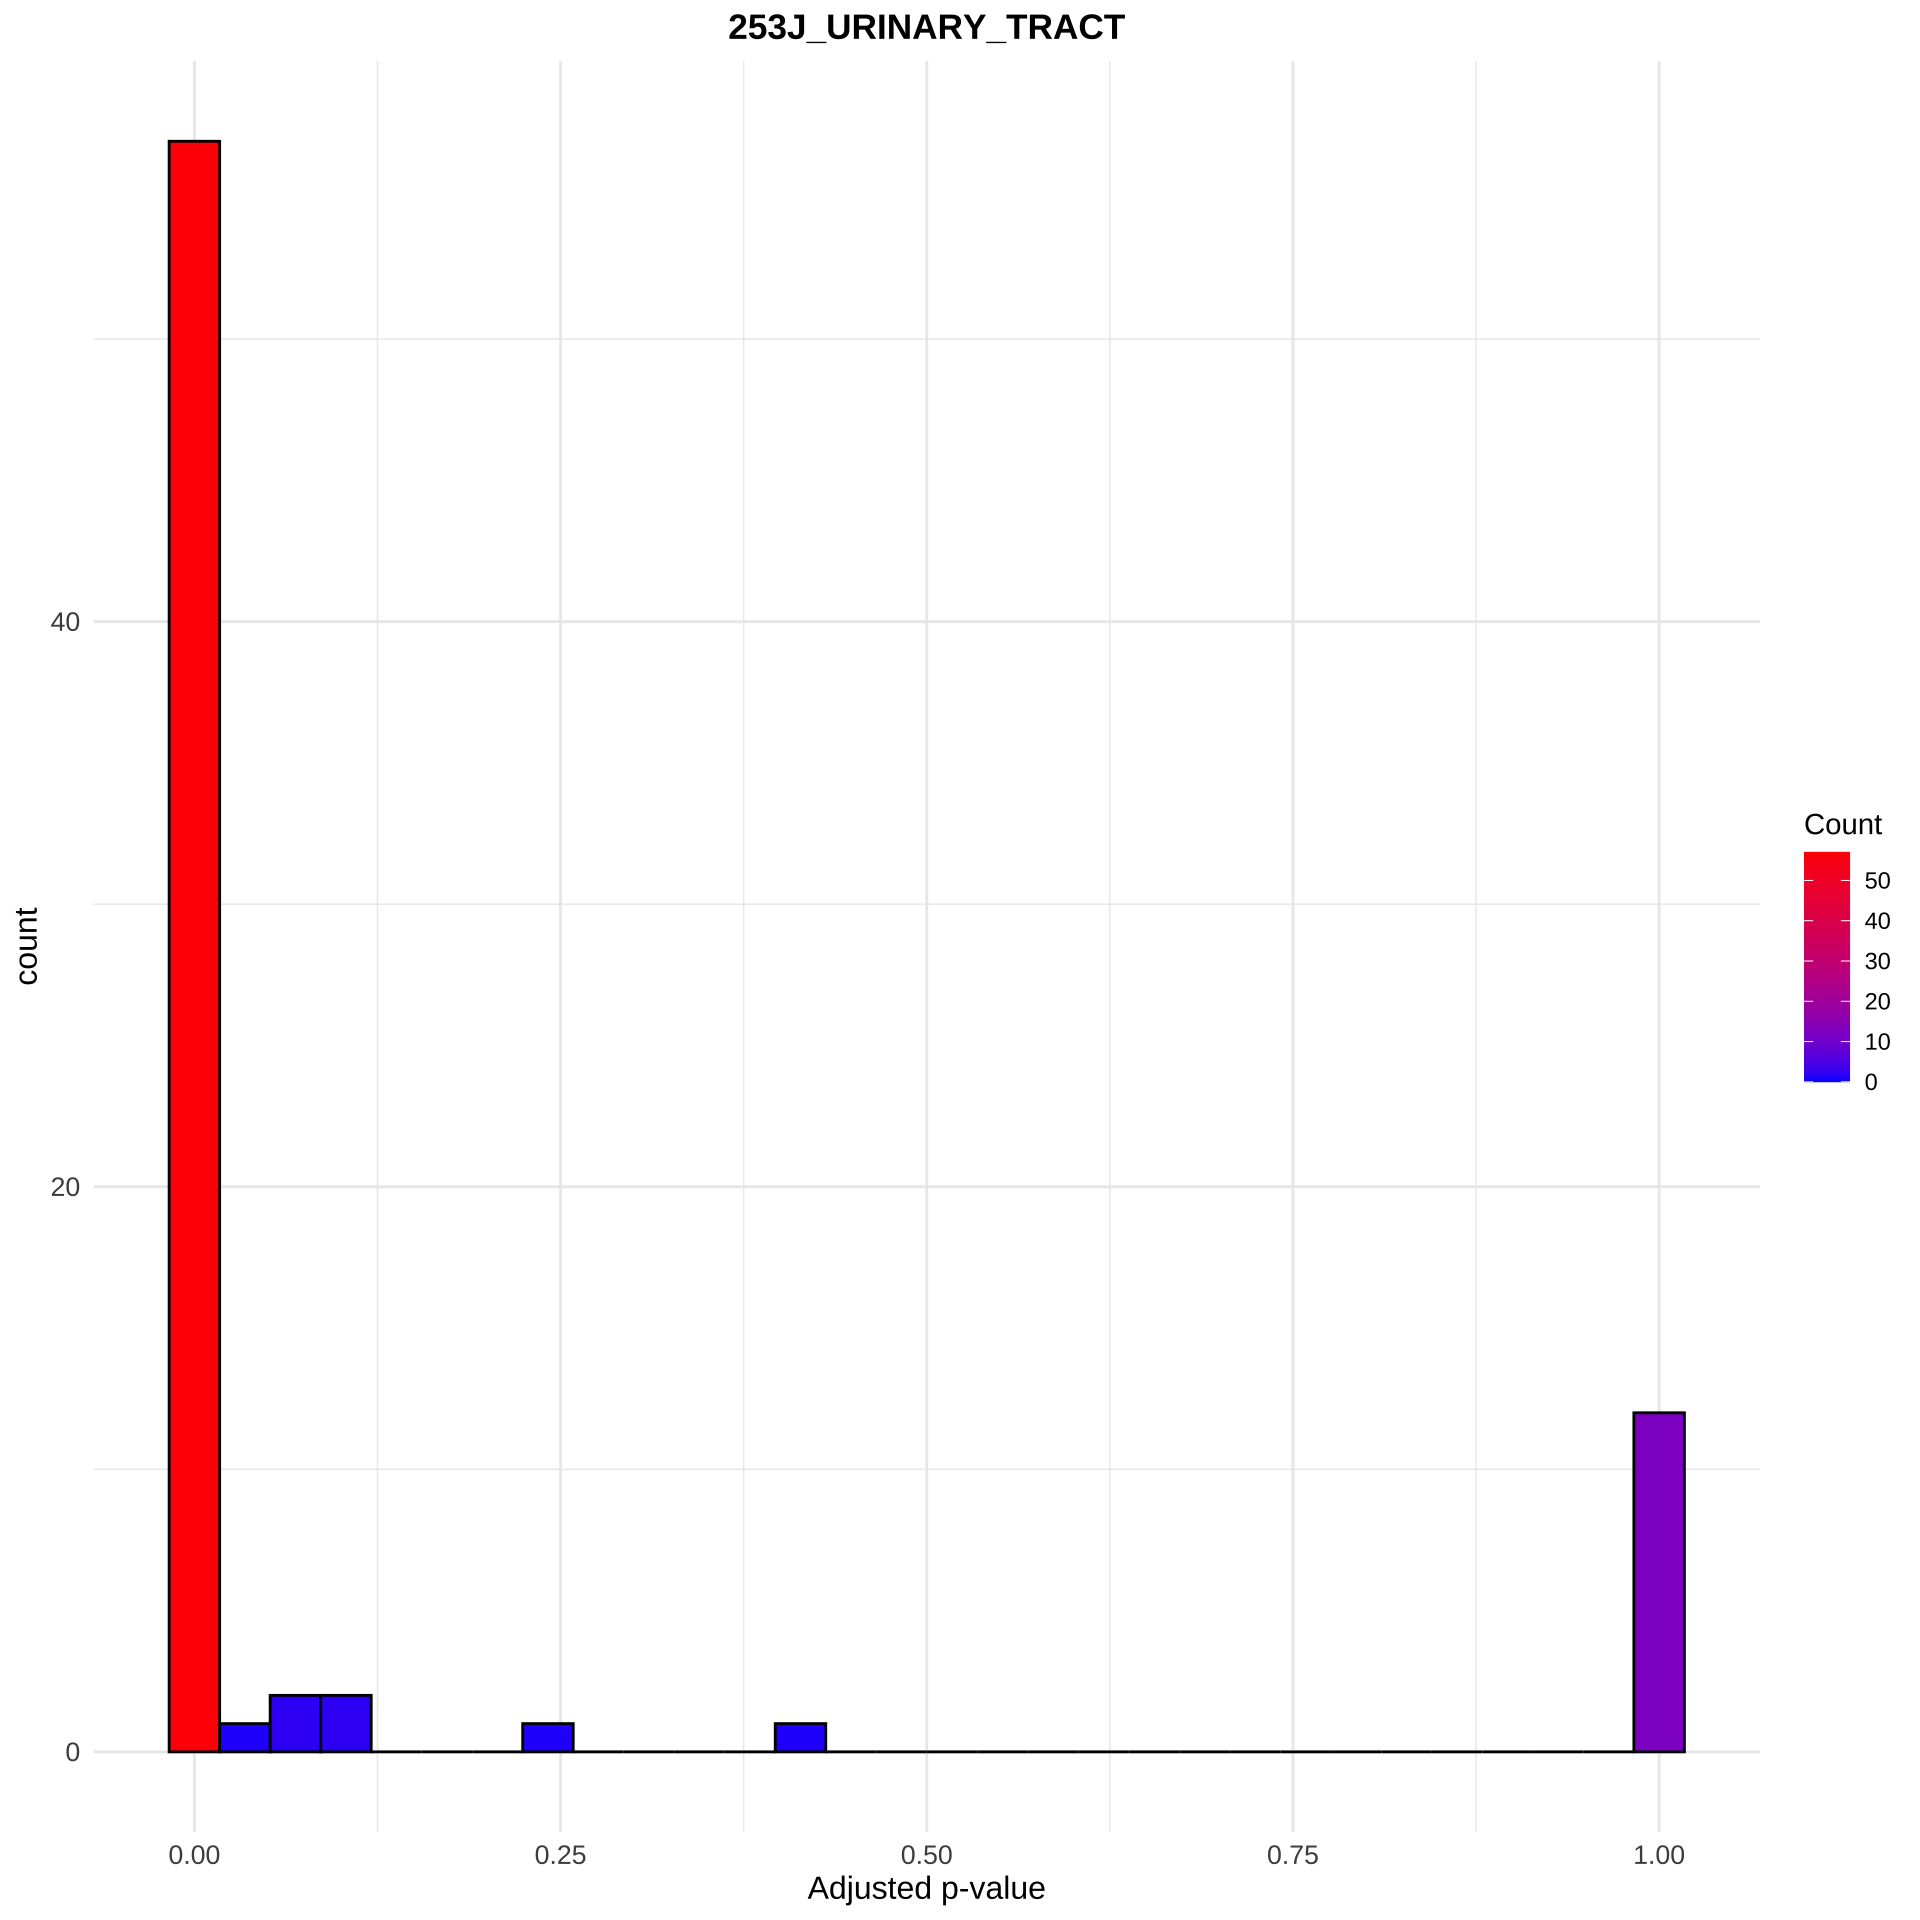
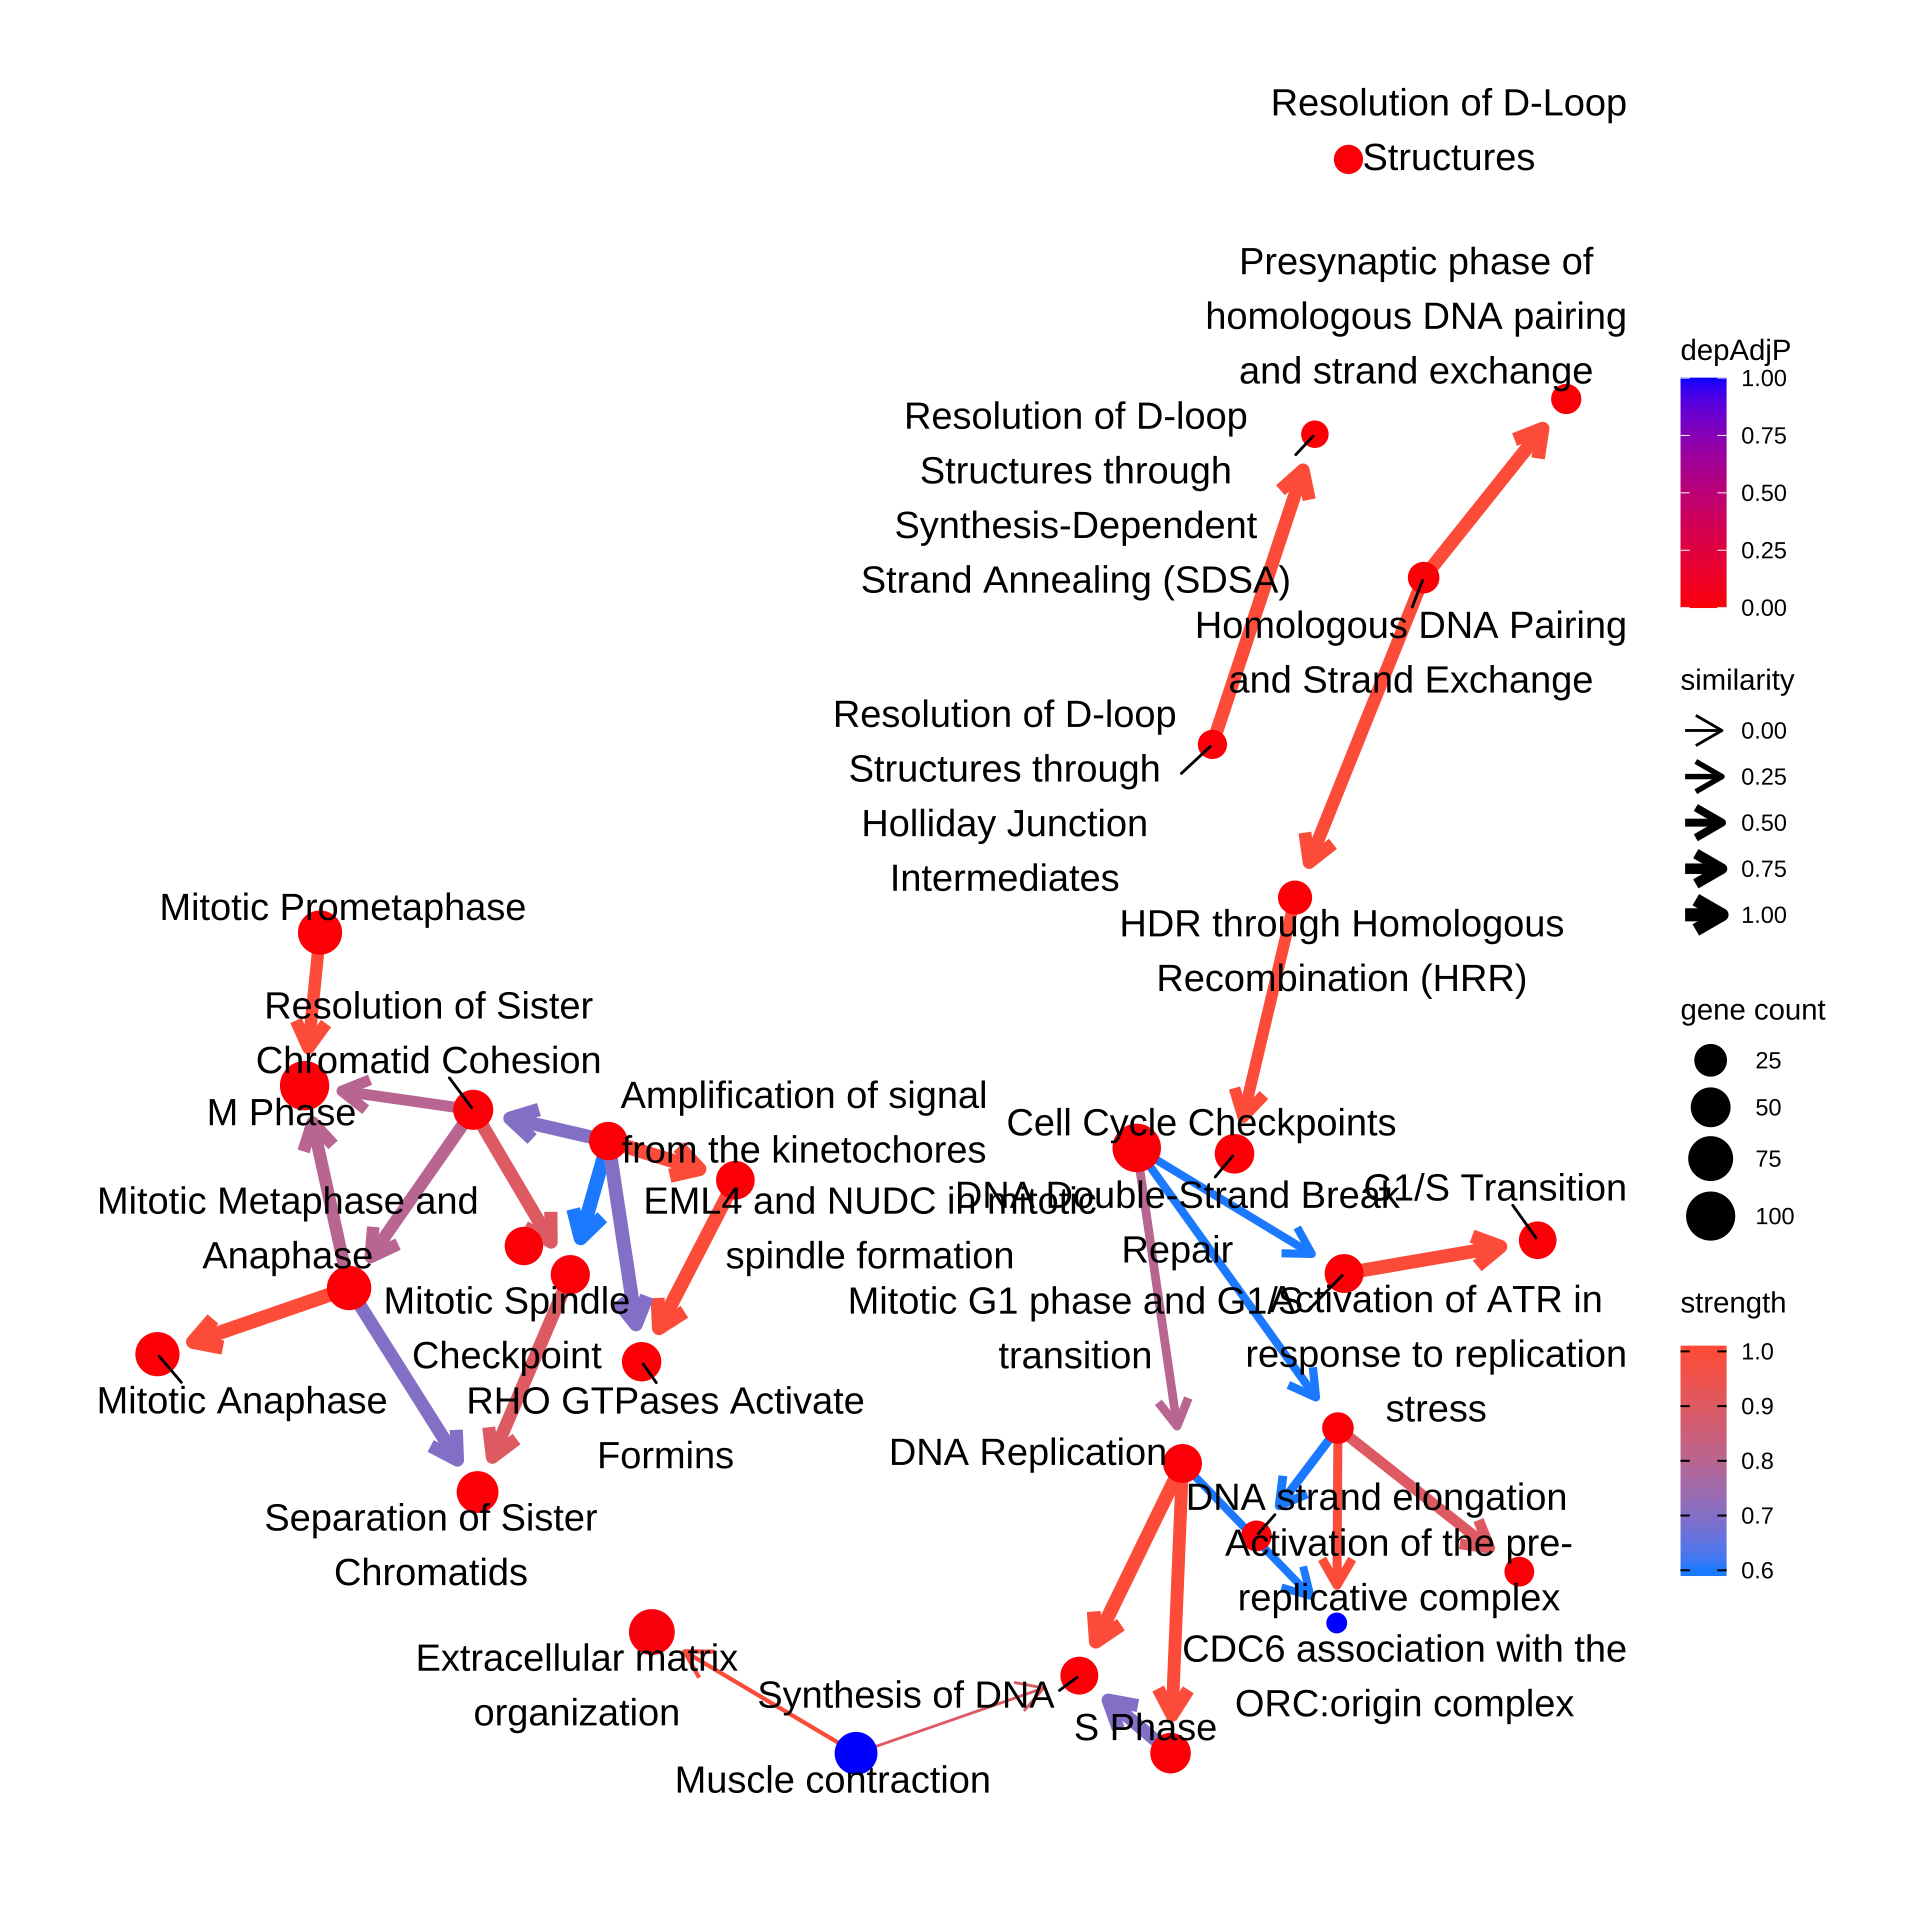
Reflect information in the plot.
bnpathplot(results = pway,
           exp = vsted,
           expSample = incSample,
           color = "depAdjP",
           nCategory = 30,
           R = 10,
           labelSize=5,
           expRow = "ENSEMBL")