Chapter 8 Testing R
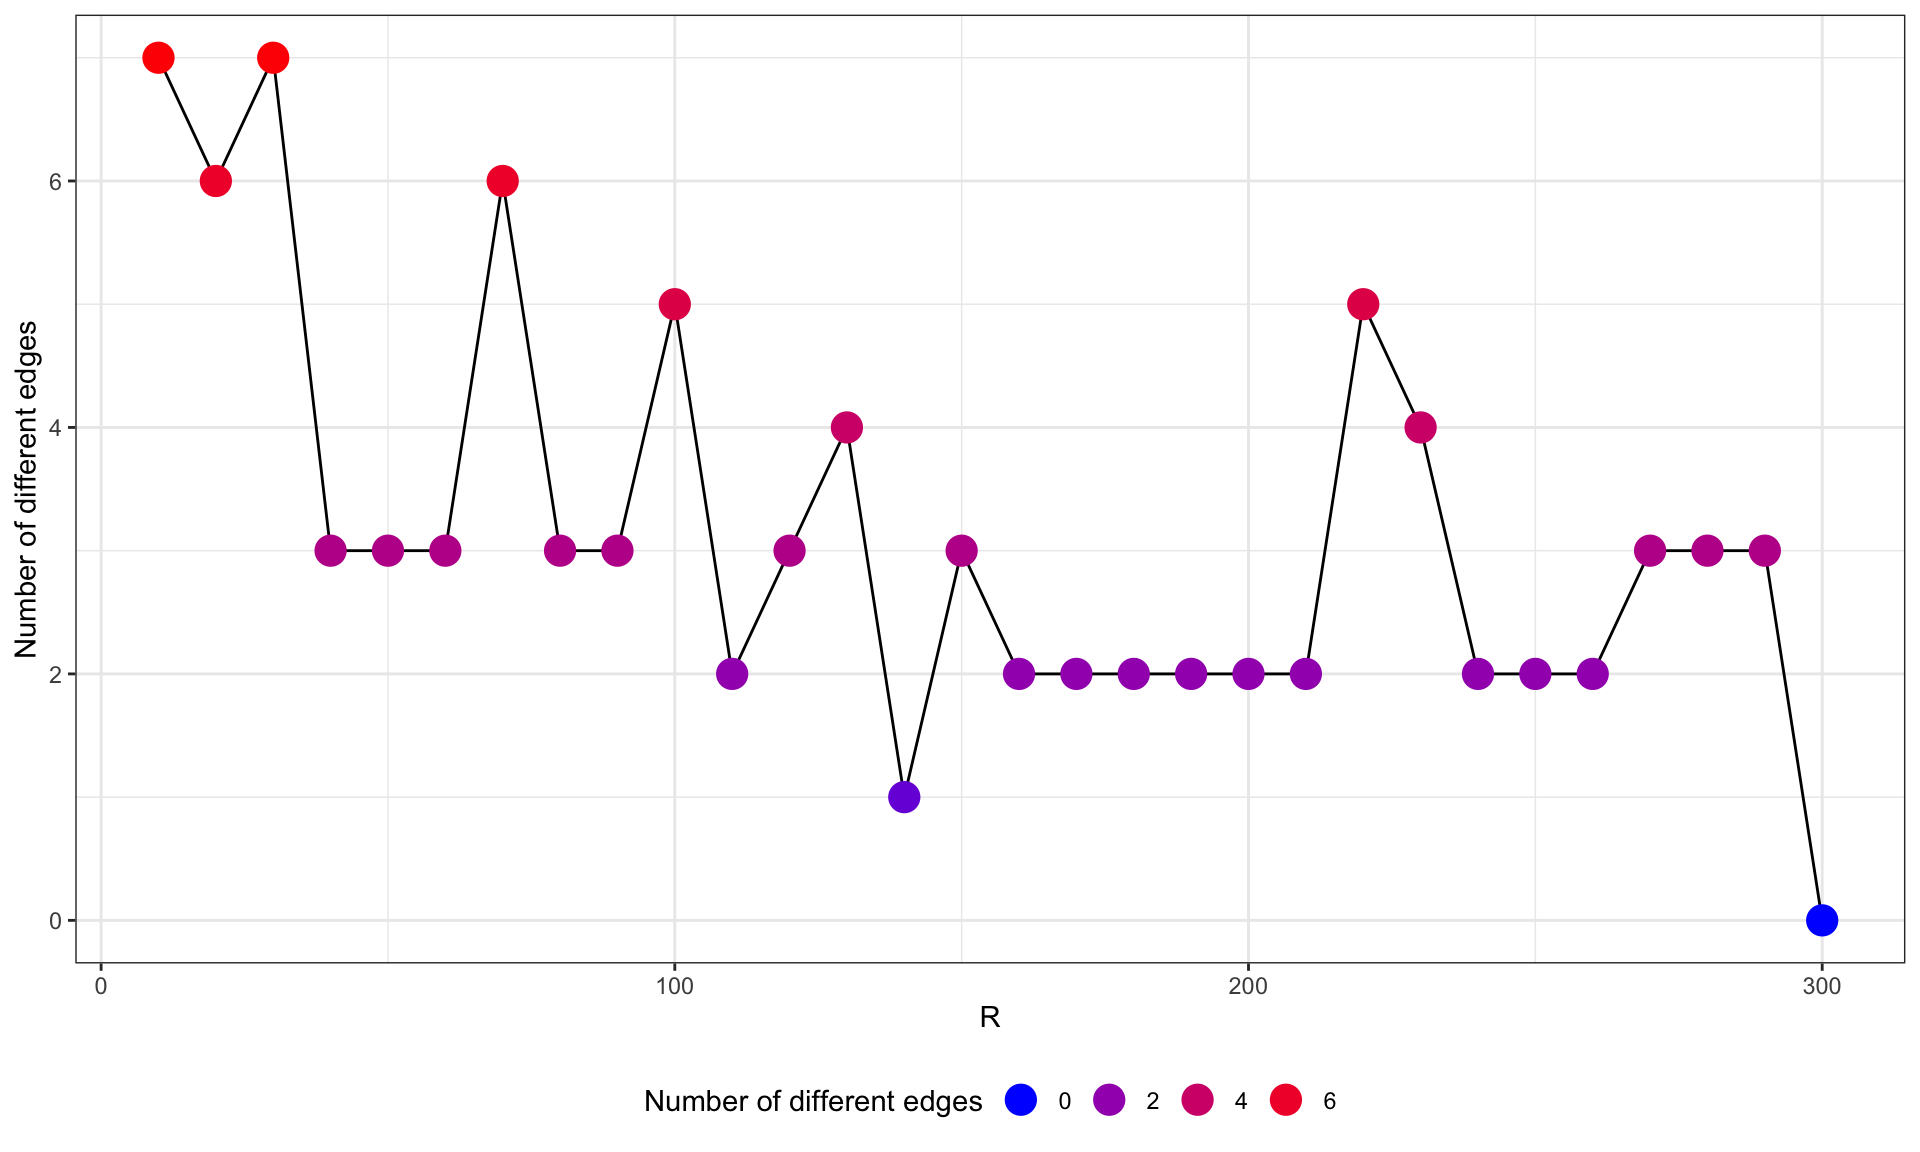
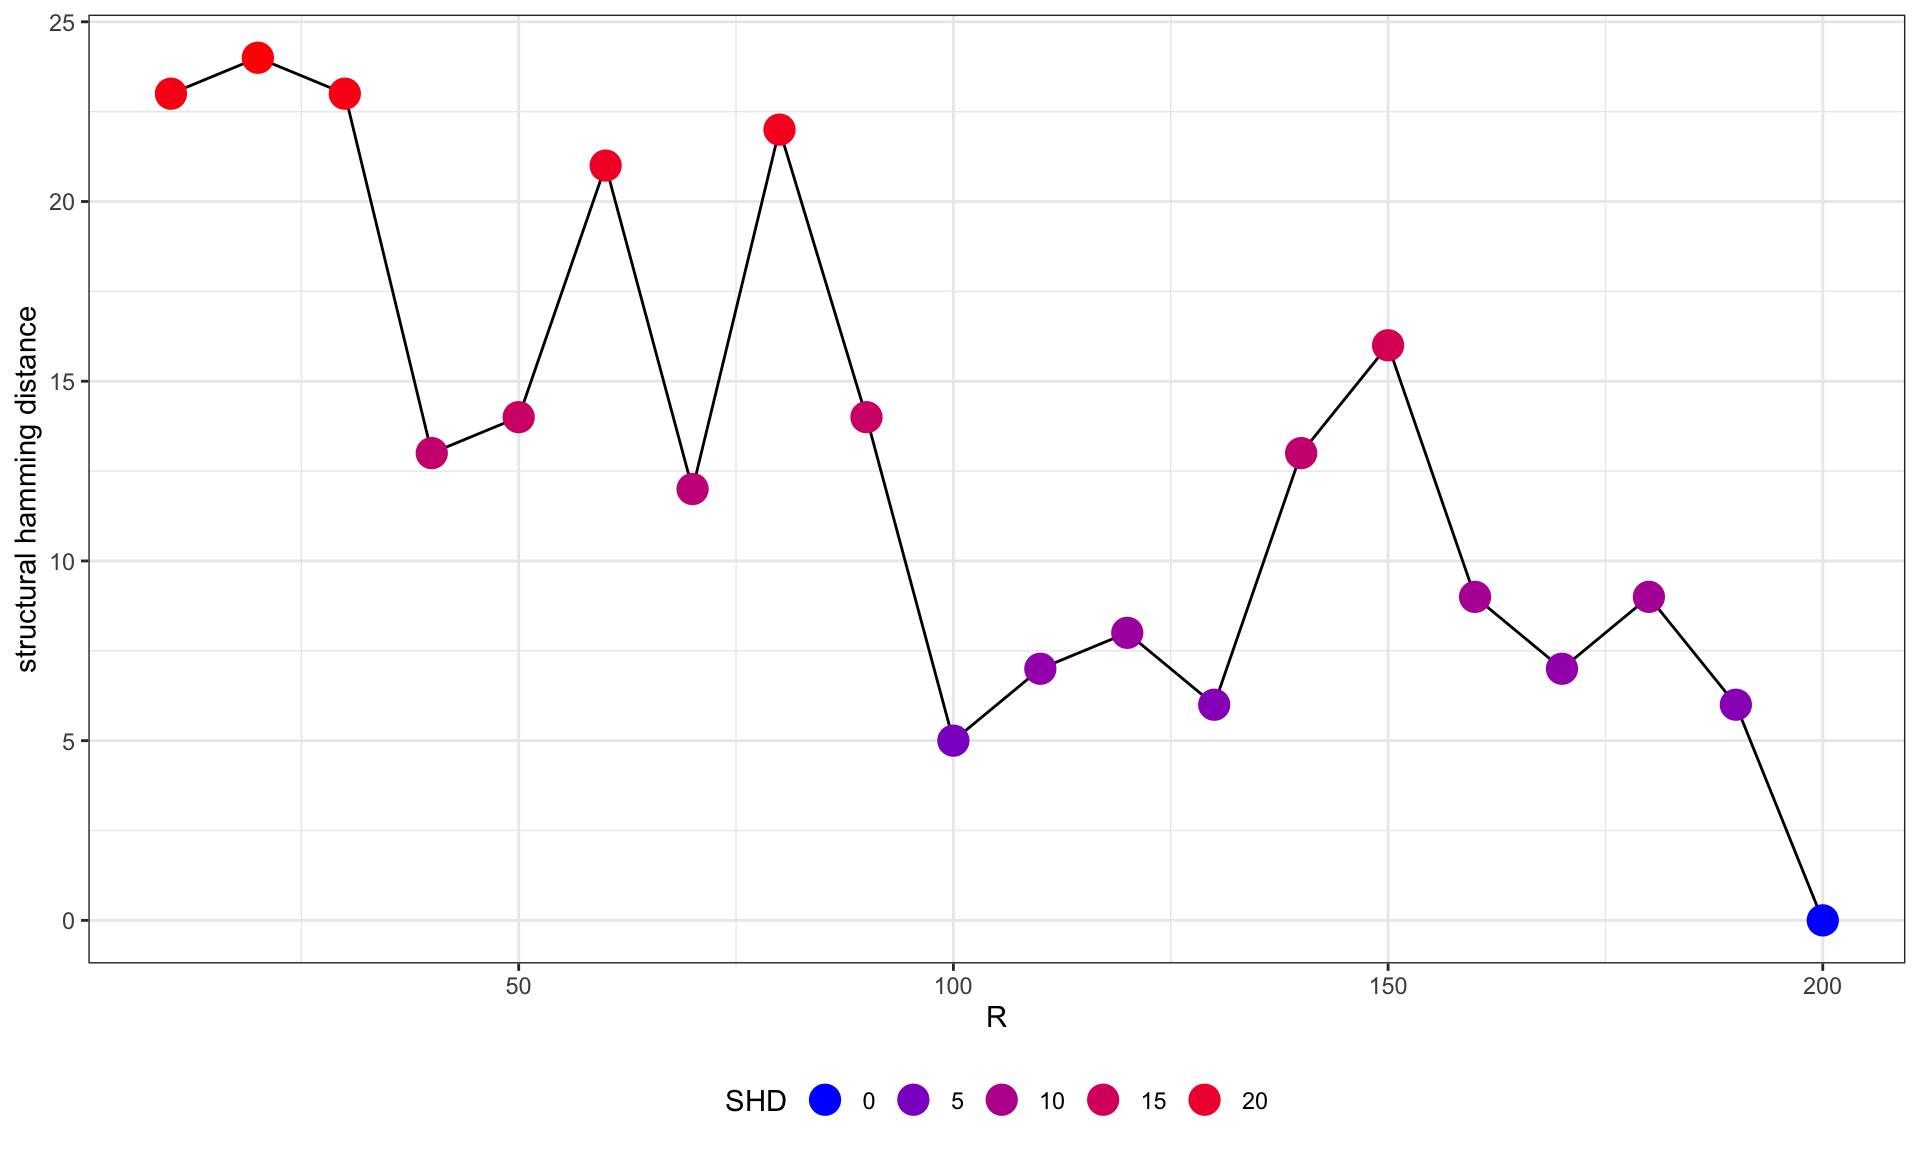
We provide the diagnostic function of inferred network across multiple bootstrap numbers. We can test how R values affect the resulting network. It is very time consuming to test many genes, thus the setting up cl argument using library parallel is suggested. We can specify which scoring function to use by scoreType. Additionaly, returned strength data frame as well as raw data frame can be used to assess various metrics and thresholds like structural hamming distance.
cl <- parallel::makeCluster(6)
pathTest <- bnpathtest(results = pway, algo="tabu",
           exp = vsted, Rrange = seq(10, 300, 10), nCategory = 15,
           expSample = incSample,
           expRow = "ENSEMBL", cl = cl)
FALSE * testing Amplification of signal from the kinetochores - Resolution of Sister Chromatid Cohesion for direction.
FALSE > initial score for node Resolution of Sister Chromatid Cohesion is 31.12572 .
FALSE > score delta for arc Amplification of signal from the kinetochores -> Resolution of Sister Chromatid Cohesion is -1.124389 .
FALSE > initial score for node Amplification of signal from the kinetochores is 15.01784 .
FALSE > score delta for arc Resolution of Sister Chromatid Cohesion -> Amplification of signal from the kinetochores is 2.416496 .
FALSE @ arc Resolution of Sister Chromatid Cohesion -> Amplification of signal from the kinetochores is better .
FALSE * testing Resolution of Sister Chromatid Cohesion - Amplification of signal from the kinetochores for direction.
FALSE > initial score for node Amplification of signal from the kinetochores is 15.01784 .
FALSE > score delta for arc Resolution of Sister Chromatid Cohesion -> Amplification of signal from the kinetochores is 2.416496 .
FALSE > initial score for node Resolution of Sister Chromatid Cohesion is 31.12572 .
FALSE > score delta for arc Amplification of signal from the kinetochores -> Resolution of Sister Chromatid Cohesion is -1.124389 .
FALSE @ arc Resolution of Sister Chromatid Cohesion -> Amplification of signal from the kinetochores is better .
FALSE * testing Mitotic Spindle Checkpoint - Activation of ATR in response to replication stress for direction.
FALSE > initial score for node Activation of ATR in response to replication stress is -24.83411 .
FALSE > score delta for arc Mitotic Spindle Checkpoint -> Activation of ATR in response to replication stress is 7.826909 .
FALSE > initial score for node Mitotic Spindle Checkpoint is -6.254592 .
FALSE > score delta for arc Activation of ATR in response to replication stress -> Mitotic Spindle Checkpoint is 3.749413 .
FALSE @ arc Mitotic Spindle Checkpoint -> Activation of ATR in response to replication stress is better .
FALSE * testing Activation of ATR in response to replication stress - Mitotic Spindle Checkpoint for direction.
FALSE > initial score for node Mitotic Spindle Checkpoint is -6.254592 .
FALSE > score delta for arc Activation of ATR in response to replication stress -> Mitotic Spindle Checkpoint is 3.749413 .
FALSE > initial score for node Activation of ATR in response to replication stress is -24.83411 .
FALSE > score delta for arc Mitotic Spindle Checkpoint -> Activation of ATR in response to replication stress is 7.826909 .
FALSE @ arc Mitotic Spindle Checkpoint -> Activation of ATR in response to replication stress is better .
FALSE * testing Activation of ATR in response to replication stress - DNA strand elongation for direction.
FALSE > initial score for node DNA strand elongation is -38.64107 .
FALSE > score delta for arc Activation of ATR in response to replication stress -> DNA strand elongation is 6.42342 .
FALSE > initial score for node Activation of ATR in response to replication stress is -19.16713 .
FALSE > score delta for arc DNA strand elongation -> Activation of ATR in response to replication stress is 2.397173 .
FALSE @ arc Activation of ATR in response to replication stress -> DNA strand elongation is better .
FALSE * testing DNA strand elongation - Activation of ATR in response to replication stress for direction.
FALSE > initial score for node Activation of ATR in response to replication stress is -19.16713 .
FALSE > score delta for arc DNA strand elongation -> Activation of ATR in response to replication stress is 2.397173 .
FALSE > initial score for node DNA strand elongation is -38.64107 .
FALSE > score delta for arc Activation of ATR in response to replication stress -> DNA strand elongation is 6.42342 .
FALSE @ arc Activation of ATR in response to replication stress -> DNA strand elongation is better .# Plot
difEdges <- sapply(pathTest$graph, function(x) sapply(pathTest$graph, function(y) length(E(difference(as.igraph(x), as.igraph(y))))))
difEdges <- data.frame(difEdges[dim(difEdges)[1], colnames(difEdges)])
colnames(difEdges) <- c("NumDif")
ggplot(difEdges, aes(x=as.numeric(substring(rownames(difEdges), 2)), y=NumDif)) +
geom_line(group=1)+
geom_point(aes(color=NumDif), size=5)+
scale_color_gradient(low = "blue", high = "red", name="Number of different edges", guide = guide_legend())+
theme_bw()+xlab("R")+ylab("Number of different edges")+
theme(legend.position="bottom")
pway@result[15,]$CountFALSE [1] 22library(parallel)
cl = makeCluster(6)
geneTest <- bngenetest(results = pway, algo="hc", pathNum=15,
exp = vsted, Rrange=seq(10, 200, 10),
expSample = incSample,
expRow = "ENSEMBL", cl = cl)FALSE * testing RFC5 - XRCC3 for direction.
FALSE > initial score for node XRCC3 is -36.77229 .
FALSE > score delta for arc RFC5 -> XRCC3 is 12.79979 .
FALSE > initial score for node RFC5 is -20.48893 .
FALSE > score delta for arc XRCC3 -> RFC5 is 3.938113 .
FALSE @ arc RFC5 -> XRCC3 is better .
FALSE * testing XRCC3 - RFC5 for direction.
FALSE > initial score for node RFC5 is -20.48893 .
FALSE > score delta for arc XRCC3 -> RFC5 is 3.938113 .
FALSE > initial score for node XRCC3 is -36.77229 .
FALSE > score delta for arc RFC5 -> XRCC3 is 12.79979 .
FALSE @ arc RFC5 -> XRCC3 is better .
FALSE * testing RFC2 - RAD51 for direction.
FALSE > initial score for node RAD51 is -22.57153 .
FALSE > score delta for arc RFC2 -> RAD51 is 0.4129817 .
FALSE > initial score for node RFC2 is -9.60327 .
FALSE > score delta for arc RAD51 -> RFC2 is 0.9636686 .
FALSE @ arc RAD51 -> RFC2 is better .
FALSE * testing RAD51 - RFC2 for direction.
FALSE > initial score for node RFC2 is -9.60327 .
FALSE > score delta for arc RAD51 -> RFC2 is 0.9636686 .
FALSE > initial score for node RAD51 is -22.57153 .
FALSE > score delta for arc RFC2 -> RAD51 is 0.4129817 .
FALSE @ arc RAD51 -> RFC2 is better .difSHD <- sapply(geneTest$graph, function(x) sapply(geneTest$graph, function(y) shd(x, y)))
# Plot SHD compared to the highest R network
difSHD <- data.frame(difSHD[dim(difSHD)[1], colnames(difSHD)])
colnames(difSHD) <- c("SHD")
ggplot(difSHD, aes(x=as.numeric(substring(rownames(difSHD), 2)), y=SHD)) +
geom_line(group=1)+
geom_point(aes(color=SHD), size=5)+
scale_color_gradient(low = "blue", high = "red", name="SHD", guide = guide_legend())+
theme_bw()+xlab("R")+ylab("structural hamming distance")+
theme(legend.position="bottom")