8 Single-cell transcriptomic data
For use with single-cell transcriptomic data, some functions are prepared. The example data used here is for the demonstrative purpose and the necessary preprocessing should be performed.
8.1 Visualizing textual information for marker genes
Visualize the network for all the cluster’s marker genes.
library(Seurat)
library(patchwork)
library(ggraph)
library(biotextgraph)
library(ggsc) ## Install using BiocManager::install("ggsc")
dir = "filtered_gene_bc_matrices/hg19"
pbmc.data <- Read10X(data.dir = dir)
pbmc <- CreateSeuratObject(counts = pbmc.data, project = "pbmc3k",
                           min.cells=3, min.features=200)
pbmc <- NormalizeData(pbmc)
pbmc <- FindVariableFeatures(pbmc, selection.method = "vst")
pbmc <- ScaleData(pbmc, features = row.names(pbmc))
pbmc <- RunPCA(pbmc, features = VariableFeatures(object = pbmc))
pbmc <- FindNeighbors(pbmc, dims = 1:10, verbose = FALSE)
pbmc <- FindClusters(pbmc, resolution = 0.5, verbose = FALSE)
pbmc <- RunTSNE(pbmc, reduction.use = "cca.aligned", dims.use = 1:20, do.fast = TRUE)
DimPlot(pbmc, reduction = "pca",
label = TRUE, pt.size = 0.5) 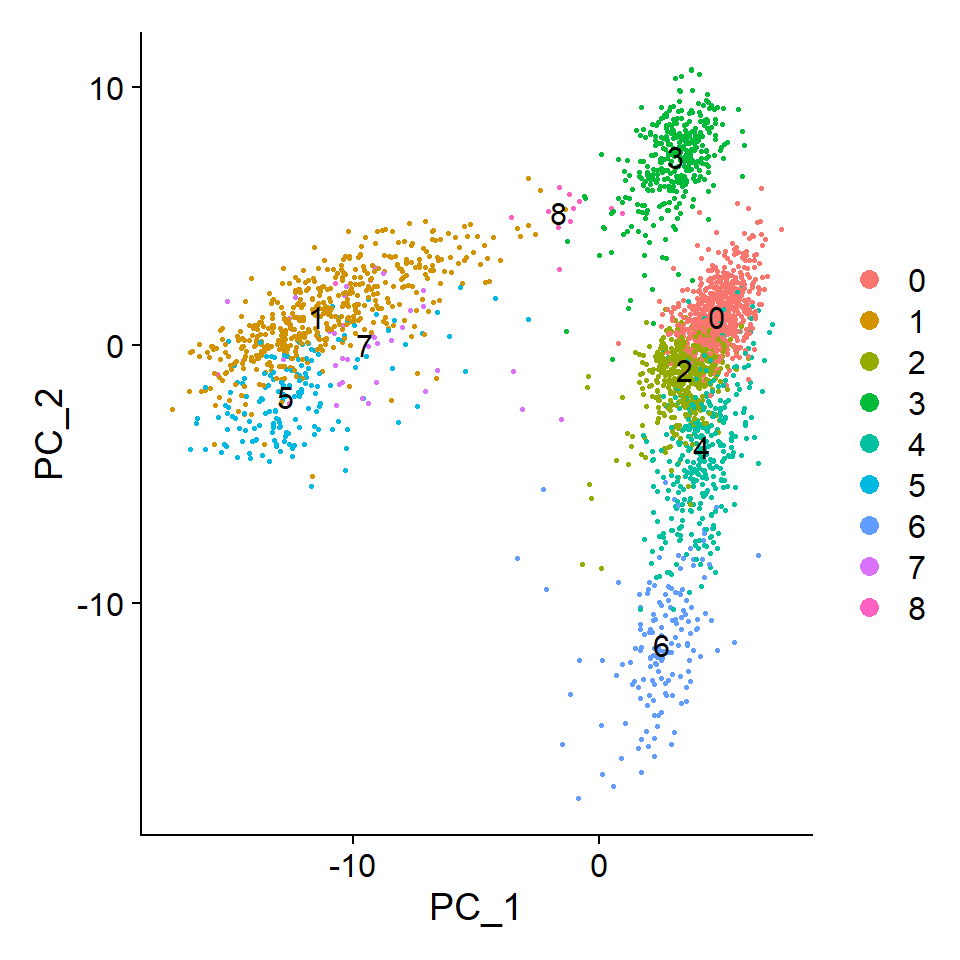
## Or, use ggsc (ggsc, https://yulab-smu.top/ggsc/)
sc_dim(pbmc) +
    sc_dim_geom_label(geom = shadowtext::geom_shadowtext,
            color='black', bg.color='white')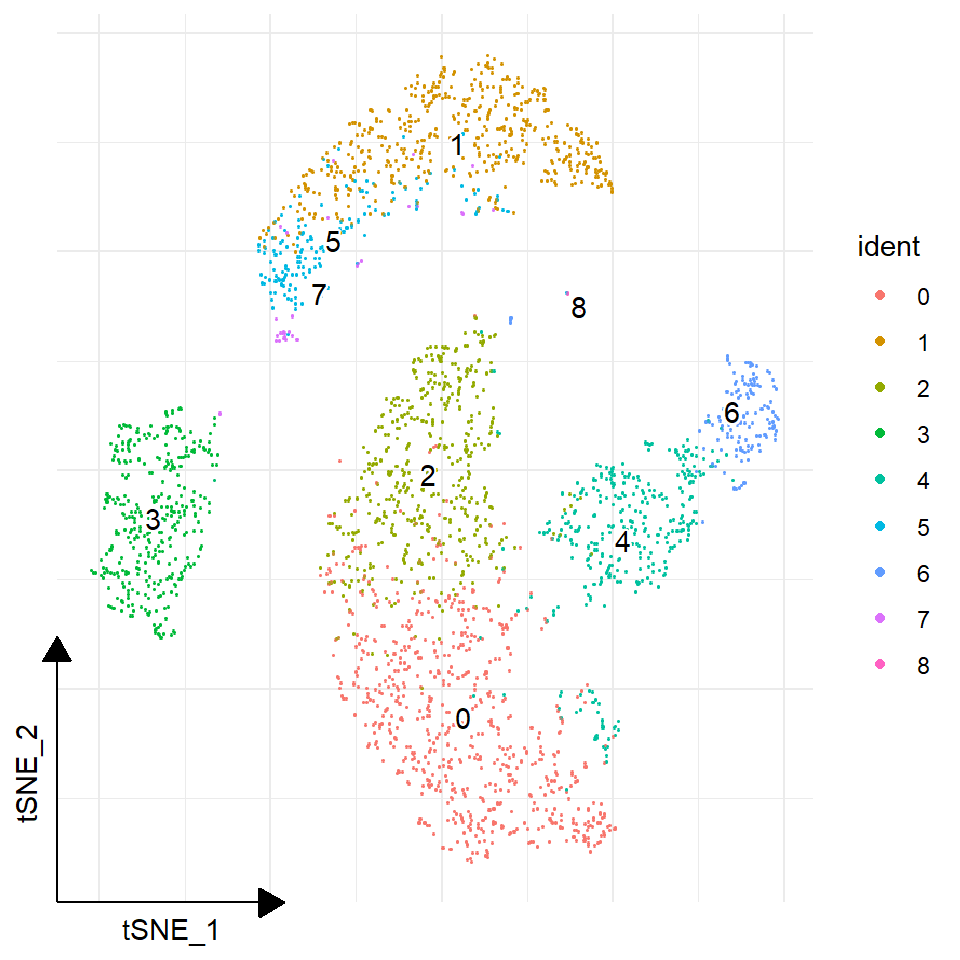
TextMarkers function can be used for Seurat results. pvalThresh can be specified.
markers <- FindAllMarkers(pbmc)
texts <- TextMarkers(markers, type="network", pvalThresh=1e-50)
#> 0
#> Input genes: 75
#>   Converted input genes: 75
#> Filter based on GeneSummary
#> Filtered 77 words (frequency and/or tfidf)
#> Ignoring corThresh, automatically determine the value
#> threshold = 0.514
#> 1
#> Input genes: 197
#>   Converted input genes: 190
#> Filter based on GeneSummary
#> Filtered 77 words (frequency and/or tfidf)
#> Ignoring corThresh, automatically determine the value
#> threshold = 0.102
#> 2
#> Input genes: 8
#>   Converted input genes: 8
#> Filter based on GeneSummary
#> Filtered 77 words (frequency and/or tfidf)
#> Ignoring corThresh, automatically determine the value
#> threshold = 0.323
#> 3
#> Input genes: 64
#>   Converted input genes: 60
#> Filter based on GeneSummary
#> Filtered 77 words (frequency and/or tfidf)
#> Ignoring corThresh, automatically determine the value
#> threshold = 0.101
#> 4
#> Input genes: 16
#>   Converted input genes: 16
#> Filter based on GeneSummary
#> Filtered 77 words (frequency and/or tfidf)
#> Ignoring corThresh, automatically determine the value
#> threshold = 0.2
#> 5
#> Input genes: 88
#>   Converted input genes: 82
#> Filter based on GeneSummary
#> Filtered 77 words (frequency and/or tfidf)
#> Ignoring corThresh, automatically determine the value
#> threshold = 0.201
#> 6
#> Input genes: 40
#>   Converted input genes: 39
#> Filter based on GeneSummary
#> Filtered 77 words (frequency and/or tfidf)
#> Ignoring corThresh, automatically determine the value
#> threshold = 0.1
#> 7
#> Input genes: 9
#>   Converted input genes: 8
#> Filter based on GeneSummary
#> Filtered 77 words (frequency and/or tfidf)
#> Ignoring corThresh, automatically determine the value
#> threshold = 0.273
#> 8
#> Input genes: 63
#>   Converted input genes: 52
#> Filter based on GeneSummary
#> Filtered 77 words (frequency and/or tfidf)
#> Ignoring corThresh, automatically determine the value
#> threshold = 0.102
wrap_plots(texts, nrow=3)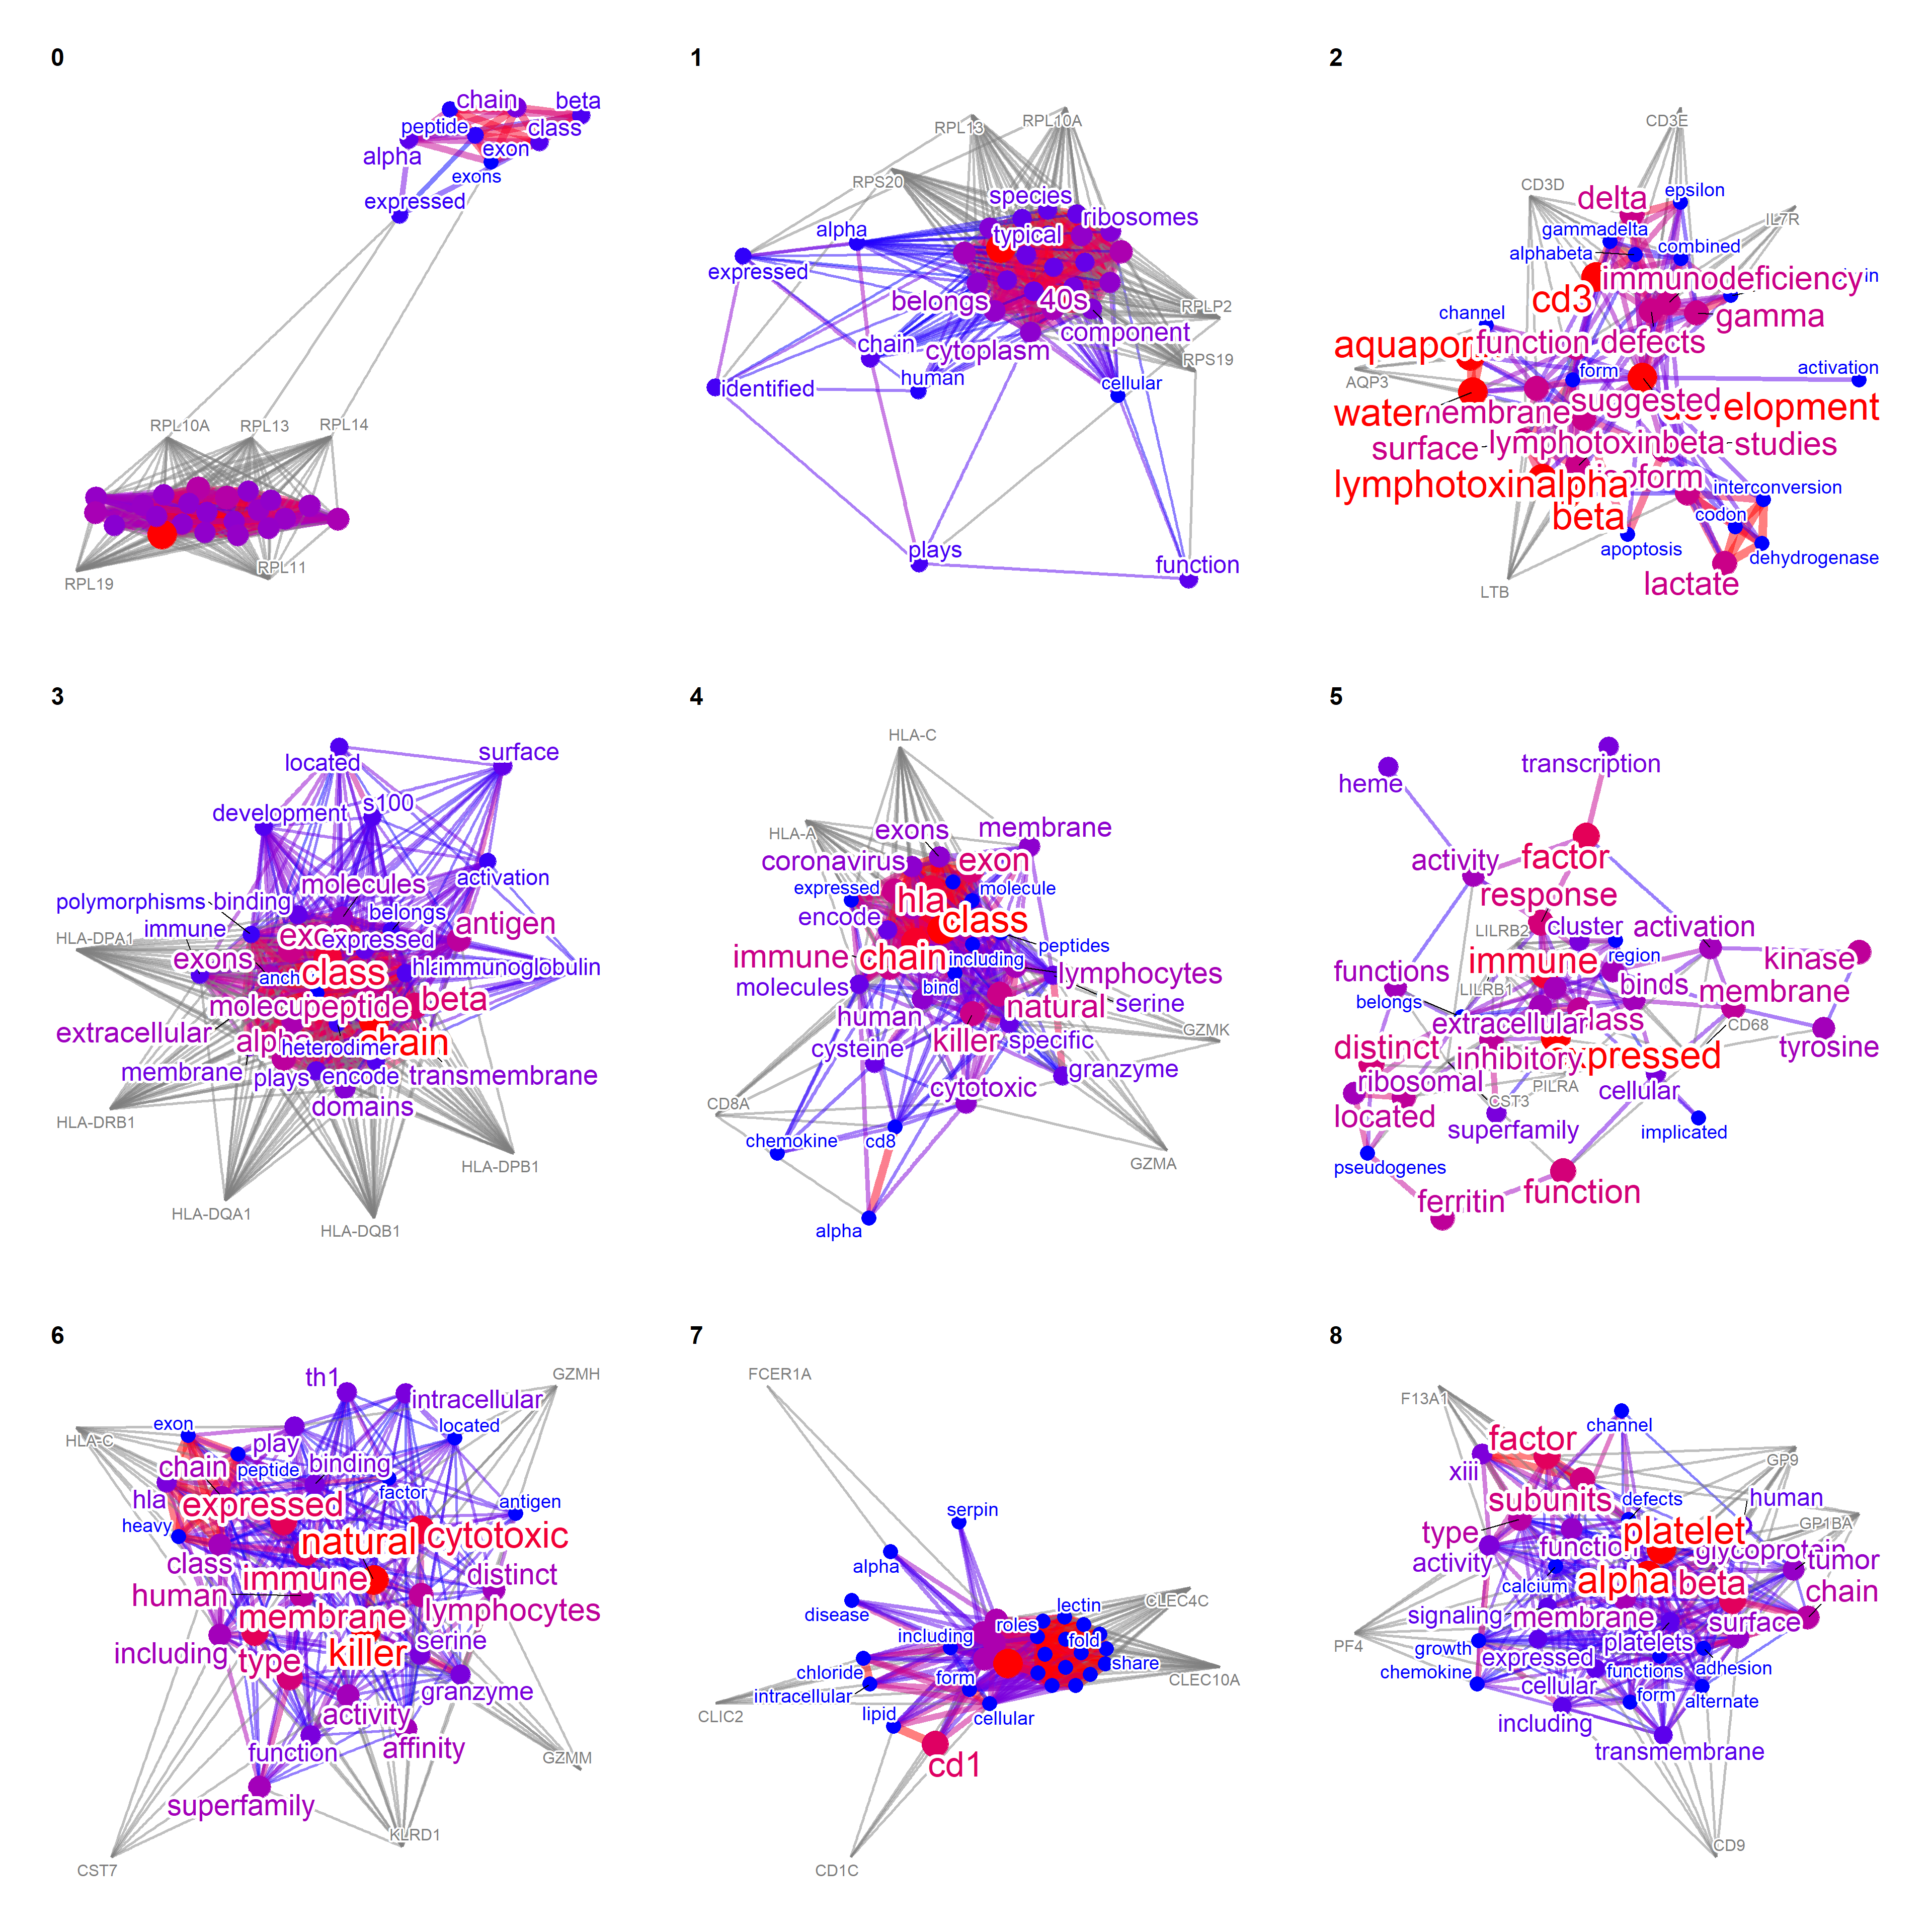
Word clouds can also be shown.
texts <- TextMarkers(subset(markers, markers$cluster %in% c("6","8")),
     type="wc", pvalThresh=1e-50, genePlot=FALSE)
#> 6
#> Input genes: 40
#>   Converted input genes: 39
#> Filter based on GeneSummary
#> Filtered 77 words (frequency and/or tfidf)
#> 8
#> Input genes: 63
#>   Converted input genes: 52
#> Filter based on GeneSummary
#> Filtered 77 words (frequency and/or tfidf)
wrap_plots(texts)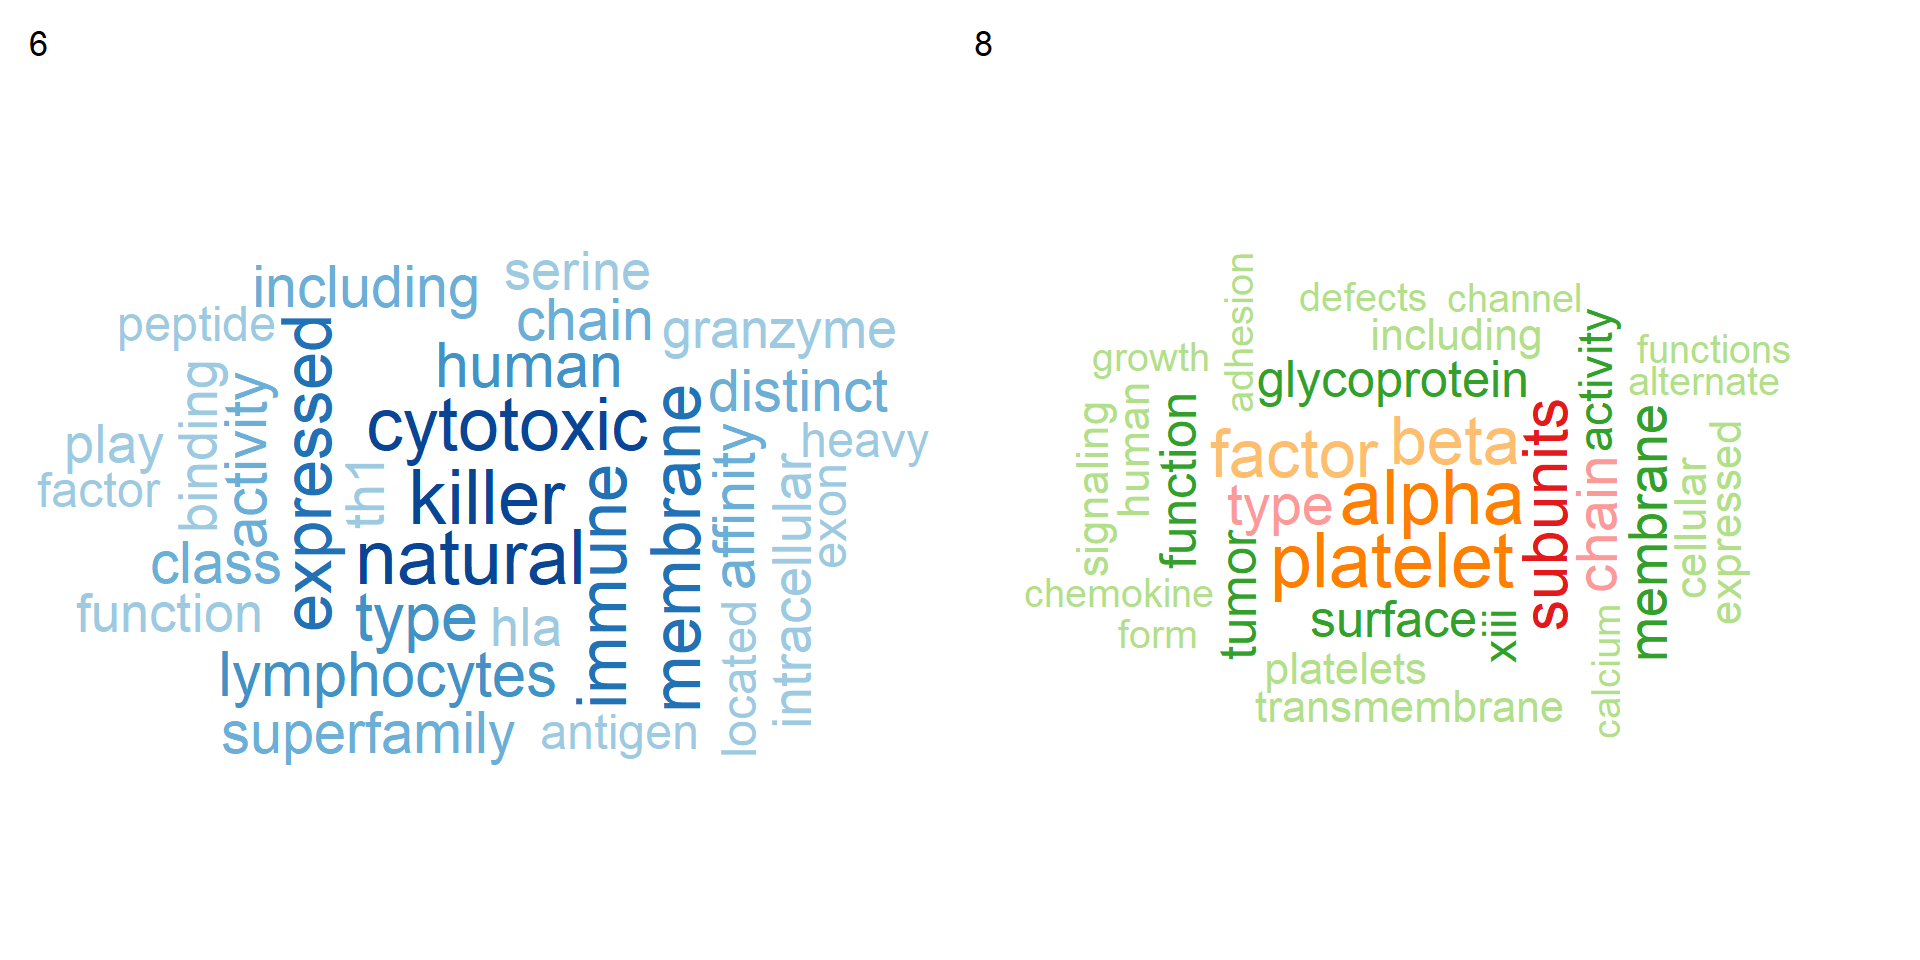
8.2 findMarkers() in scran
sce <- as.SingleCellExperiment(pbmc)
colLabels(sce) <- colData(sce)$ident
colData(sce)$label <- colData(sce)$ident
The function TextMarkersScran performs text fetching recursively for each cluster.
marker.info <- findMarkers(sce, colLabels(sce))
texts <- marker.info |> TextMarkersScran(top=5)
#> 0
#> Input genes: 28
#>   Converted input genes: 28
#> Filter based on GeneSummary
#> Filtered 77 words (frequency and/or tfidf)
#> 1
#> Input genes: 20
#>   Converted input genes: 20
#> Filter based on GeneSummary
#> Filtered 77 words (frequency and/or tfidf)
#> 2
#> Input genes: 27
#>   Converted input genes: 27
#> Filter based on GeneSummary
#> Filtered 77 words (frequency and/or tfidf)
#> 3
#> Input genes: 22
#>   Converted input genes: 22
#> Filter based on GeneSummary
#> Filtered 77 words (frequency and/or tfidf)
#> 4
#> Input genes: 19
#>   Converted input genes: 19
#> Filter based on GeneSummary
#> Filtered 77 words (frequency and/or tfidf)
#> 5
#> Input genes: 18
#>   Converted input genes: 16
#> Filter based on GeneSummary
#> Filtered 77 words (frequency and/or tfidf)
#> 6
#> Input genes: 20
#>   Converted input genes: 20
#> Filter based on GeneSummary
#> Filtered 77 words (frequency and/or tfidf)
#> 7
#> Input genes: 26
#>   Converted input genes: 25
#> Filter based on GeneSummary
#> Filtered 77 words (frequency and/or tfidf)
#> 8
#> Input genes: 21
#>   Converted input genes: 20
#> Filter based on GeneSummary
#> Filtered 77 words (frequency and/or tfidf)
texts$`6`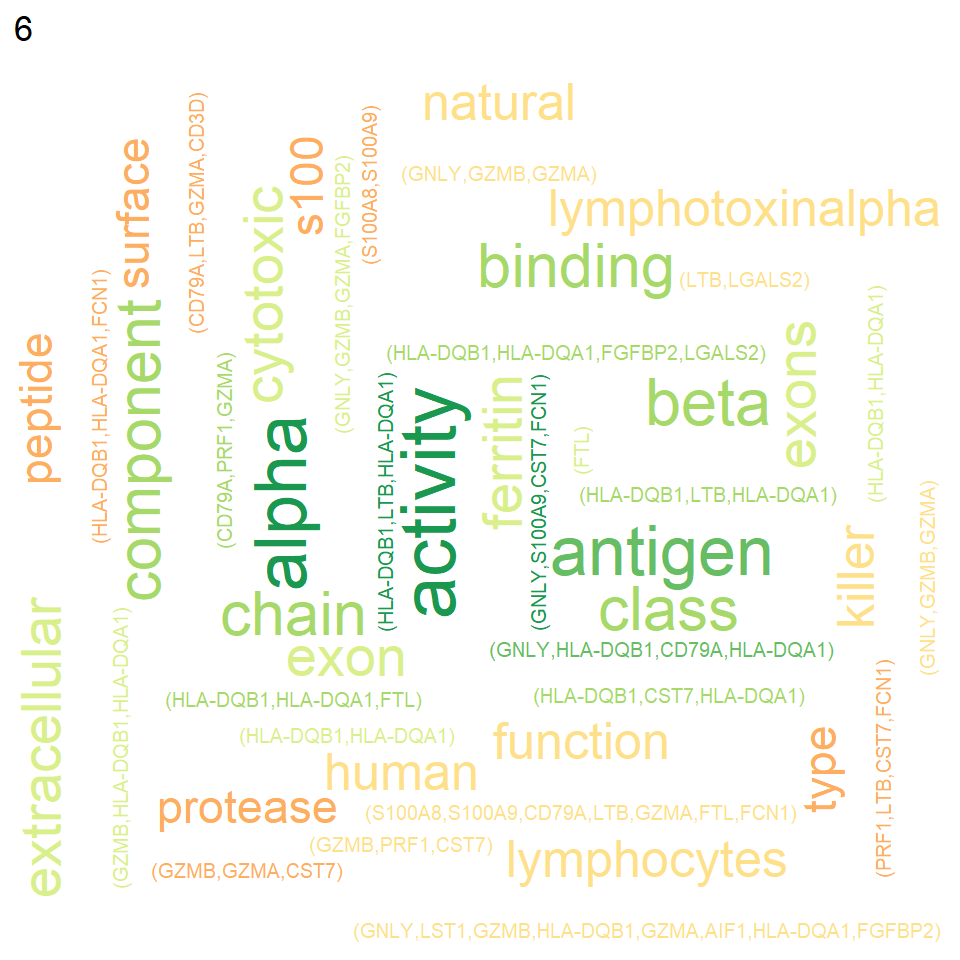
8.3 Map resulting wordcloud plots on the dimensionality reducing plot.
Single-cell level wordclouds can be plotted on the reduced dimension plot of cells.
The title in the wordcloud or network can be suppressed by withTitle=FALSE in TextMarkers functions.
A function is prepared to generate colors and show word cloud on the reduced dimension plot using the same color as the original plot (plotReducedDimWithTexts).
This function can use use_shadowtext in ggwordcloud::geom_text_wordcloud, which is available from the forked repository (noriakis/ggwordcloud).
bg.colour is used to specify background color. Otherwise, one can specify ggfx filtering functions to withggfx and ggfxParams as parameters, which reflects to wordcloud.
For SingleCellExperiment,
library(ggfx)
candLabel <- c("0","6")

plotReducedDimWithTexts(sce, marker.info, colour_by="label",point_alpha=0.3,
    use_shadowtext=TRUE, which.label=candLabel)
#> 0
#> Input genes: 28
#>   Converted input genes: 28
#> Filter based on GeneSummary
#> Filtered 77 words (frequency and/or tfidf)
#> 6
#> Input genes: 20
#>   Converted input genes: 20
#> Filter based on GeneSummary
#> Filtered 77 words (frequency and/or tfidf)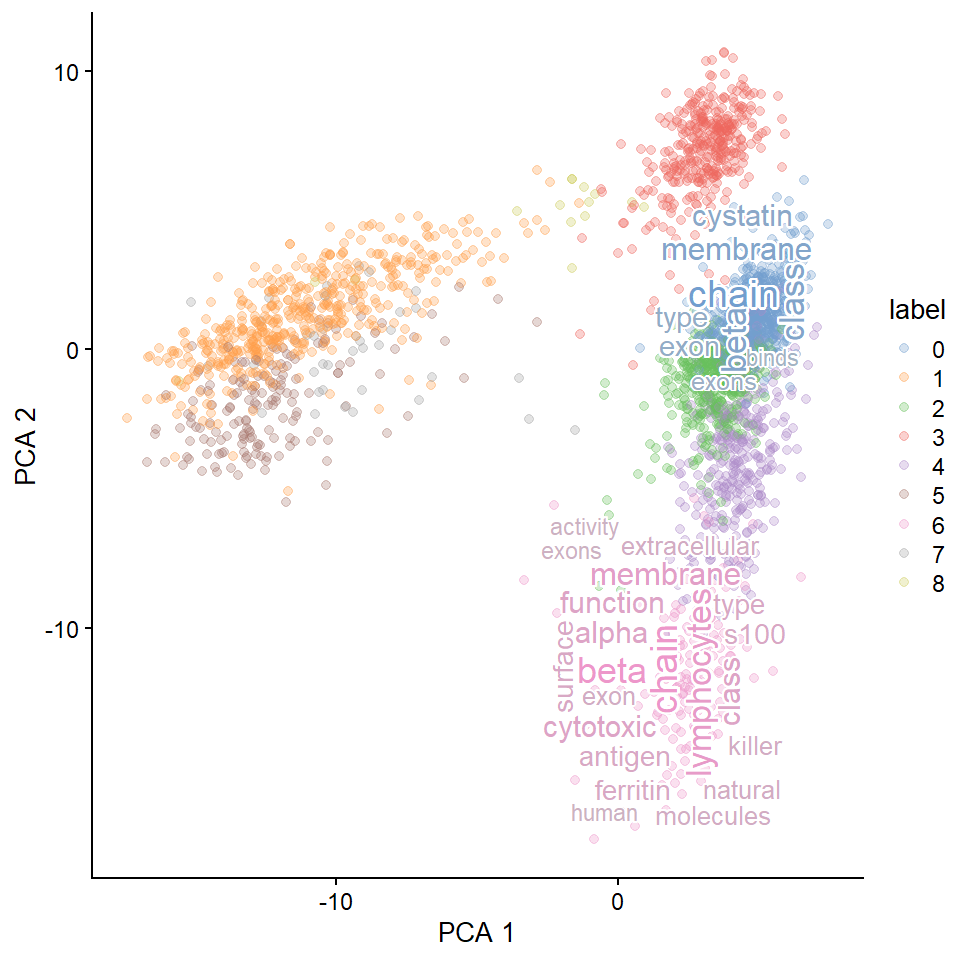
## Change the bg.colour
plotReducedDimWithTexts(sce, marker.info, colour_by="label",point_alpha=0.3,
    use_shadowtext=TRUE, bg.colour="tomato",
    which.label=candLabel)
#> 0
#> Input genes: 28
#>   Converted input genes: 28
#> Filter based on GeneSummary
#> Filtered 77 words (frequency and/or tfidf)
#> 6
#> Input genes: 20
#>   Converted input genes: 20
#> Filter based on GeneSummary
#> Filtered 77 words (frequency and/or tfidf)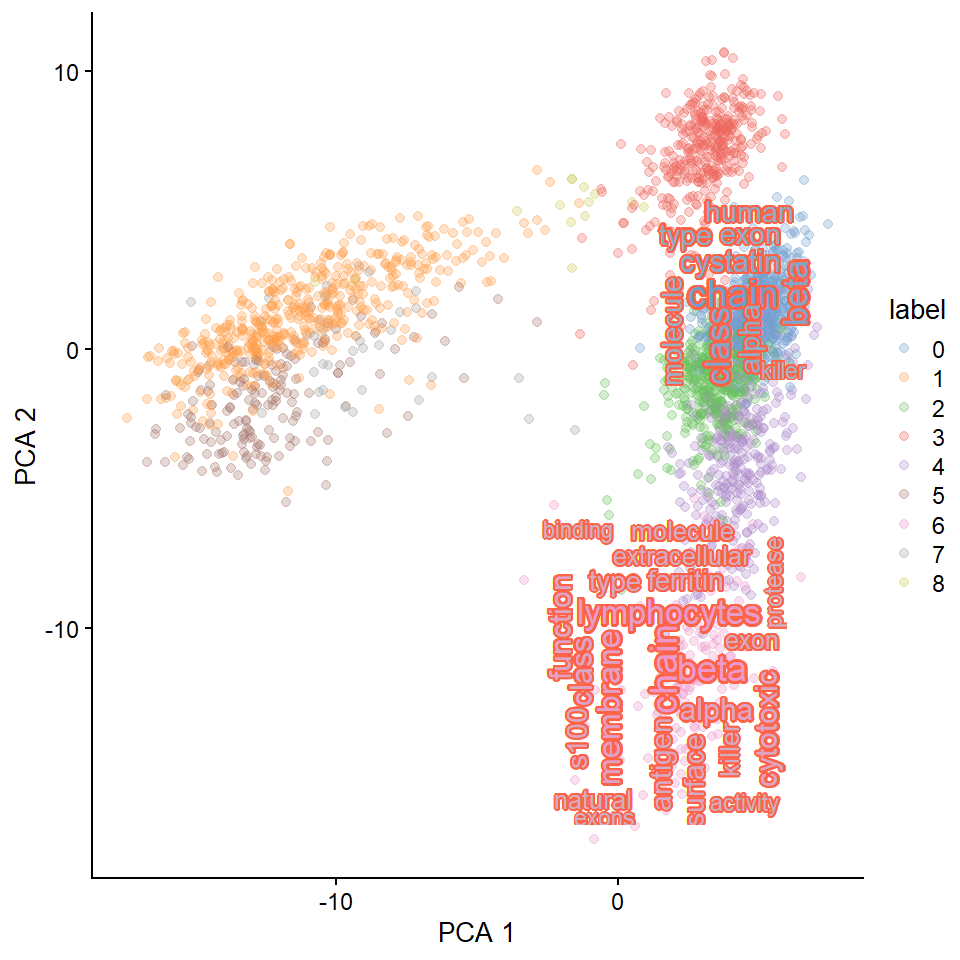
## Use `with_outer_glow`
plotReducedDimWithTexts(sce, marker.info, colour_by="label",point_alpha=0.3,
    use_shadowtext=FALSE, withggfx="with_outer_glow",
    which.label=candLabel)
#> 0
#> Input genes: 28
#>   Converted input genes: 28
#> Filter based on GeneSummary
#> Filtered 77 words (frequency and/or tfidf)
#> 6
#> Input genes: 20
#>   Converted input genes: 20
#> Filter based on GeneSummary
#> Filtered 77 words (frequency and/or tfidf)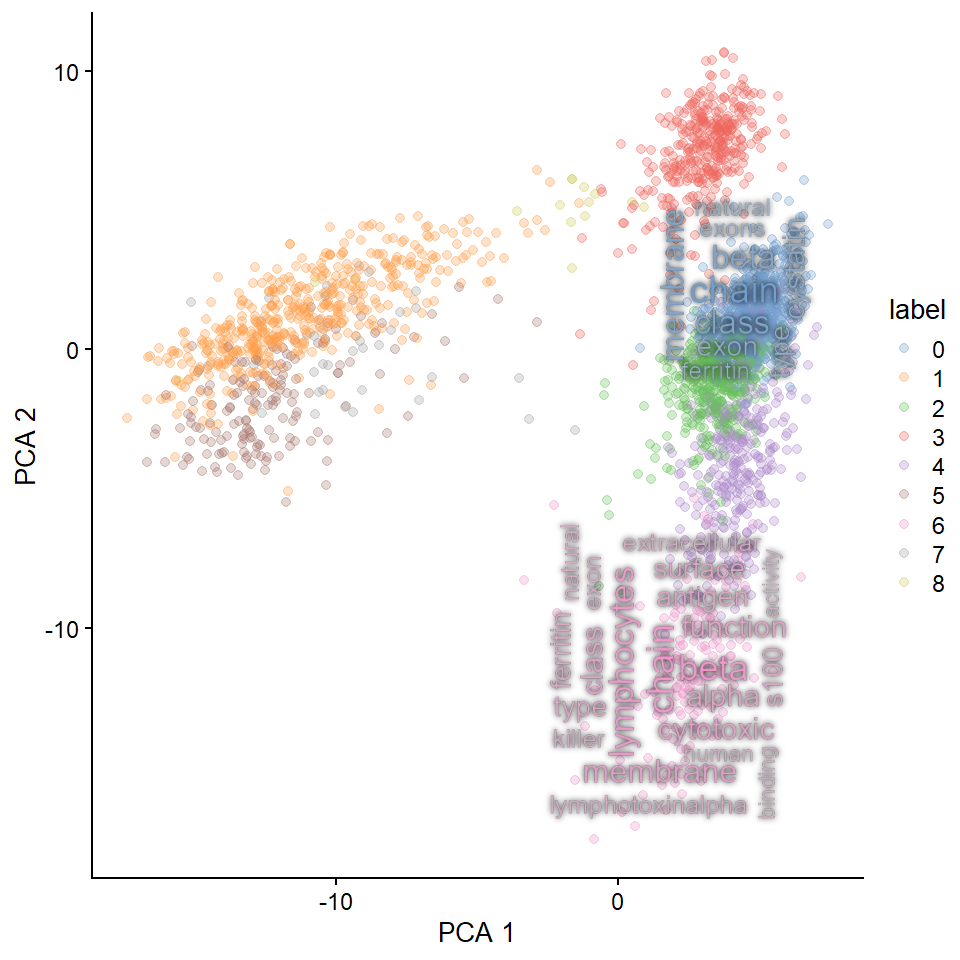
## Use `with_outer_glow` with parameters
## Should only be used for just the visualization purpose
plotReducedDimWithTexts(sce, marker.info, colour_by="label",point_alpha=0.3,
    use_shadowtext=FALSE, withggfx="with_outer_glow", dimred="TSNE",
    ggfxParams=list(colour="white", expand=2),
    which.label=c("2","3"))+
    theme(axis.line=element_blank(),
        axis.text.x=element_blank(),
        axis.text.y=element_blank(),
        axis.ticks=element_blank(),
        axis.title.x=element_blank(),
        axis.title.y=element_blank(),
        legend.position="none",
        panel.background=element_blank(),
        panel.border=element_blank(),
        panel.grid.major=element_blank(),
        panel.grid.minor=element_blank(),
        plot.background=element_blank())
#> 2
#> Input genes: 27
#>   Converted input genes: 27
#> Filter based on GeneSummary
#> Filtered 77 words (frequency and/or tfidf)
#> 3
#> Input genes: 22
#>   Converted input genes: 22
#> Filter based on GeneSummary
#> Filtered 77 words (frequency and/or tfidf)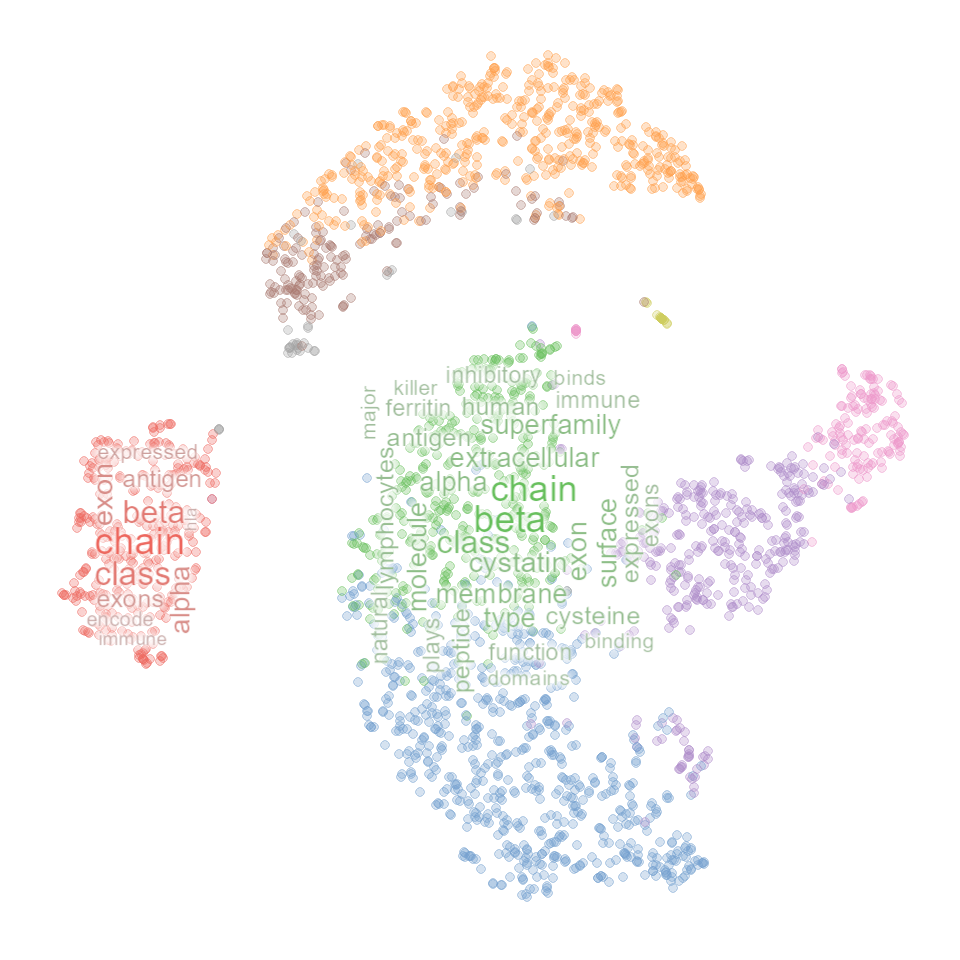
## Change the font
## Use alien encounter fonts (http://www.hipsthetic.com/alien-encounters-free-80s-font-family/)
sysfonts::font_add(family="alien",regular="SFAlienEncounters.ttf")
showtext::showtext_auto()
plotReducedDimWithTexts(sce, marker.info, colour_by="label",point_alpha=0.3,
                        use_shadowtext=TRUE, bg.colour="white", args=list(fontFamily="alien"),
                        which.label=c("6"), wcScale=6)
#> 6
#> Input genes: 20
#>   Converted input genes: 20
#> Filter based on GeneSummary
#> Filtered 77 words (frequency and/or tfidf)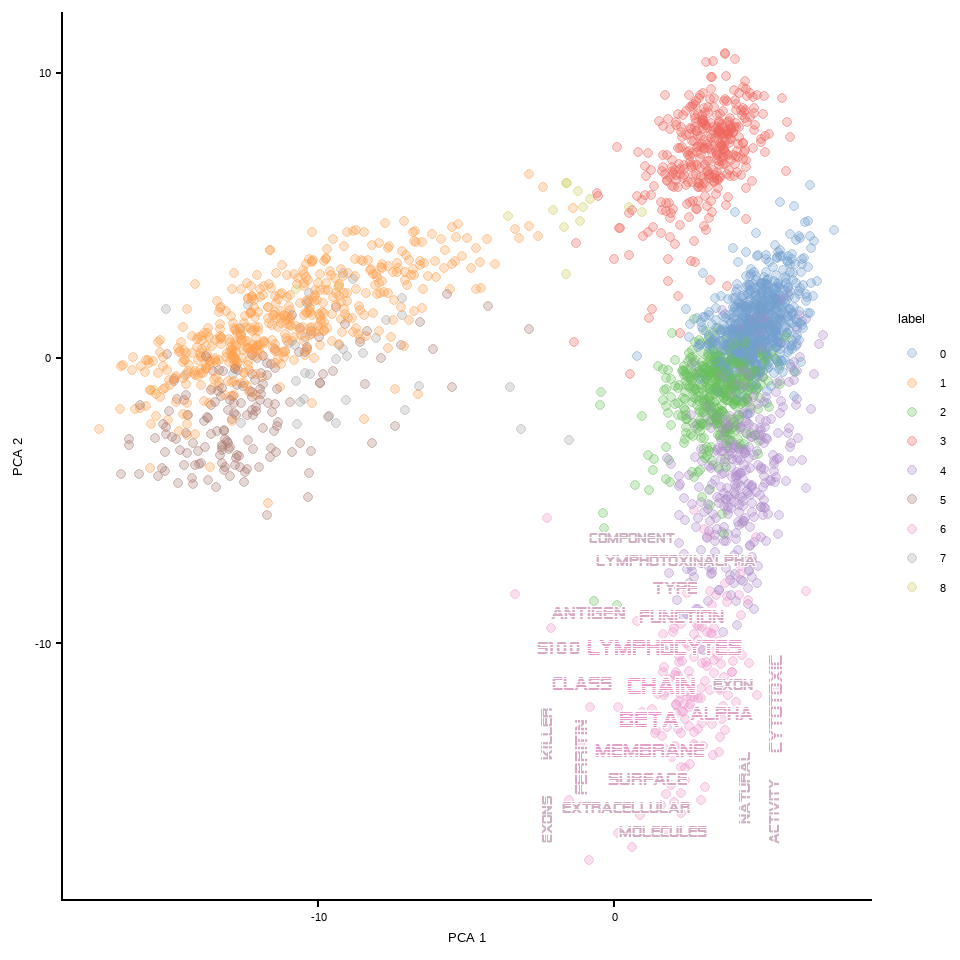
For the Seurat object, use DimPlotWithTexts().
r <- rep(4, length(unique(markers$cluster)))
names(r) <- unique(markers$cluster)
DimPlotWithTexts(pbmc, markers, label=FALSE, rad=r, which.label=c("1","4"), wcScale=6)
#> 1
#> Input genes: 1027
#>   Converted input genes: 966
#> Filter based on GeneSummary
#> Filtered 77 words (frequency and/or tfidf)
#> 4
#> Input genes: 316
#>   Converted input genes: 298
#> Filter based on GeneSummary
#> Filtered 77 words (frequency and/or tfidf)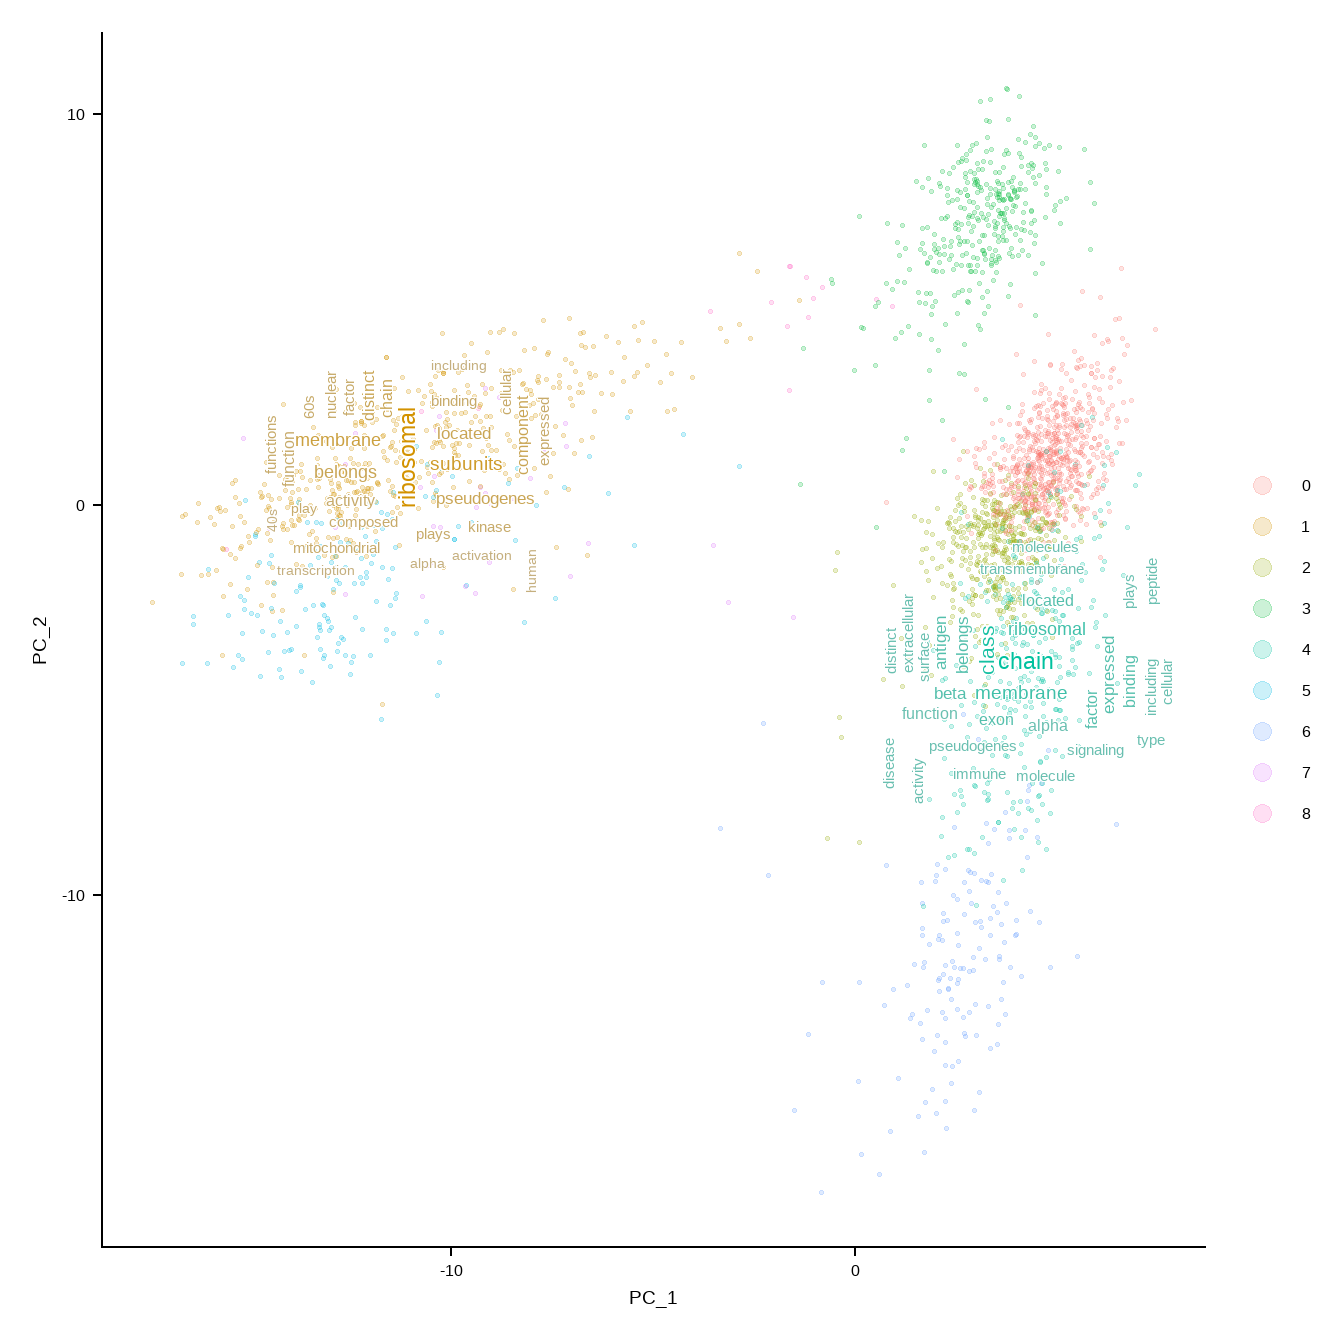
Give the function a data frame that is already filtered, like thersholding by adjusted p-values.
r <- rep(2, length(unique(markers$cluster)))
names(r) <- unique(markers$cluster)
thresh <- subset(markers, markers$p_val_adj<1e-50)
DimPlotWithTexts(pbmc,
    thresh,
    label=FALSE,
    rad=r,
    which.label=c("2","4","6"),
    args=list(numWords=50,scaleFreq=5))
#> 2
#> Input genes: 8
#>   Converted input genes: 8
#> Filter based on GeneSummary
#> Filtered 77 words (frequency and/or tfidf)
#> 4
#> Input genes: 16
#>   Converted input genes: 16
#> Filter based on GeneSummary
#> Filtered 77 words (frequency and/or tfidf)
#> 6
#> Input genes: 40
#>   Converted input genes: 39
#> Filter based on GeneSummary
#> Filtered 77 words (frequency and/or tfidf)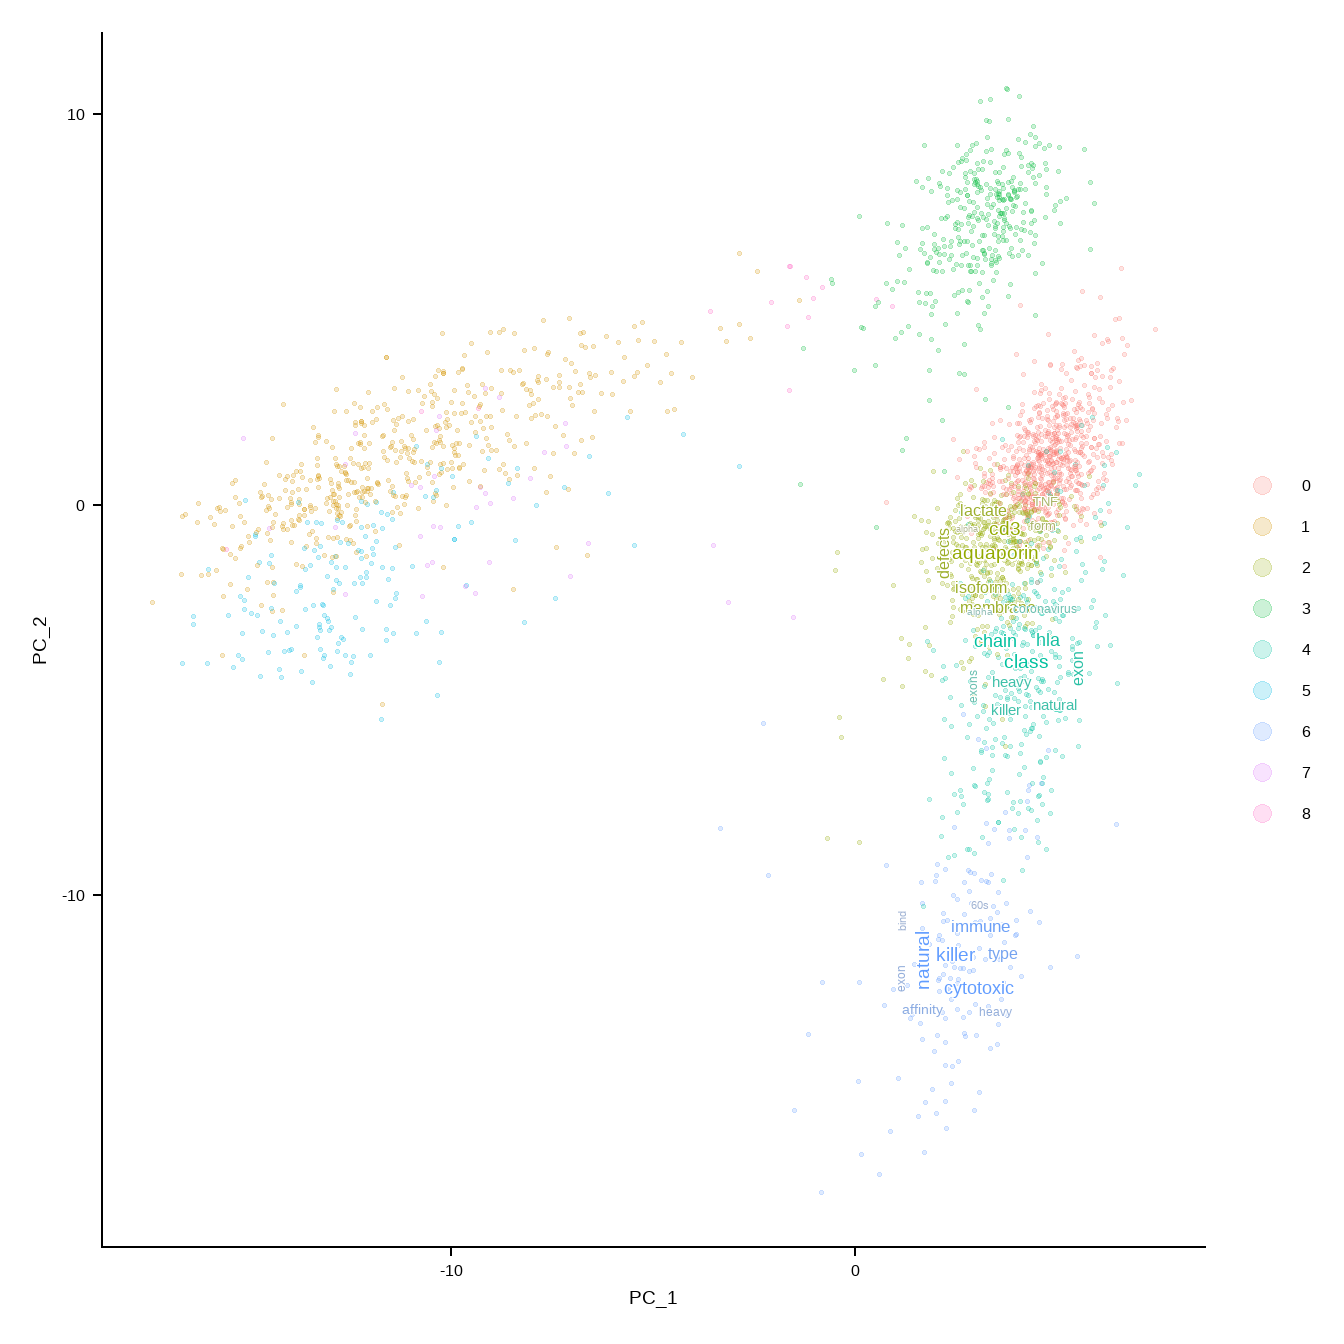
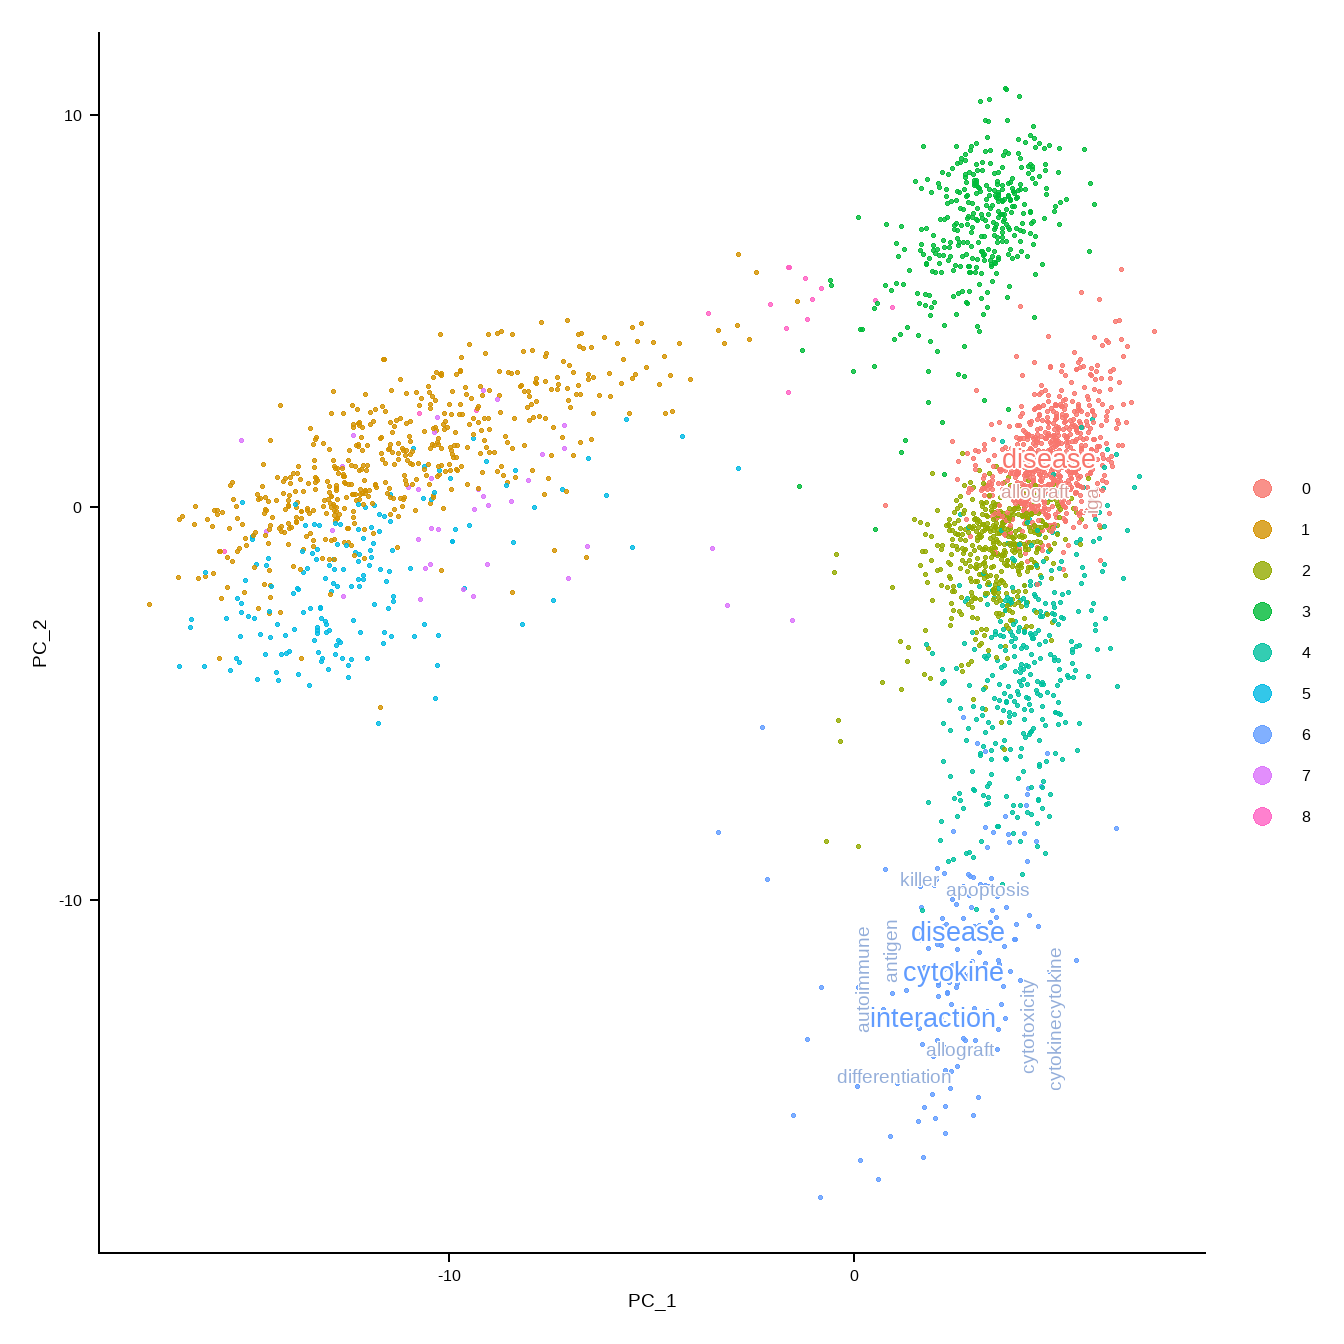
geom_sc_wordcloud is prepared to use in conjuction with ggsc.
sc_dim(pbmc,reduction = "pca")+
  geom_sc_wordcloud(markers, show_markers = c(3,5),
                    p_val_adj_threshold = 1e-50, wcScale=7)+
  sc_dim_geom_label(geom = shadowtext::geom_shadowtext,
                  color='black', bg.color='white')
#> 3
#> Input genes: 64
#>   Converted input genes: 60
#> Filter based on GeneSummary
#> Filtered 77 words (frequency and/or tfidf)
#> 5
#> Input genes: 88
#>   Converted input genes: 82
#> Filter based on GeneSummary
#> Filtered 77 words (frequency and/or tfidf)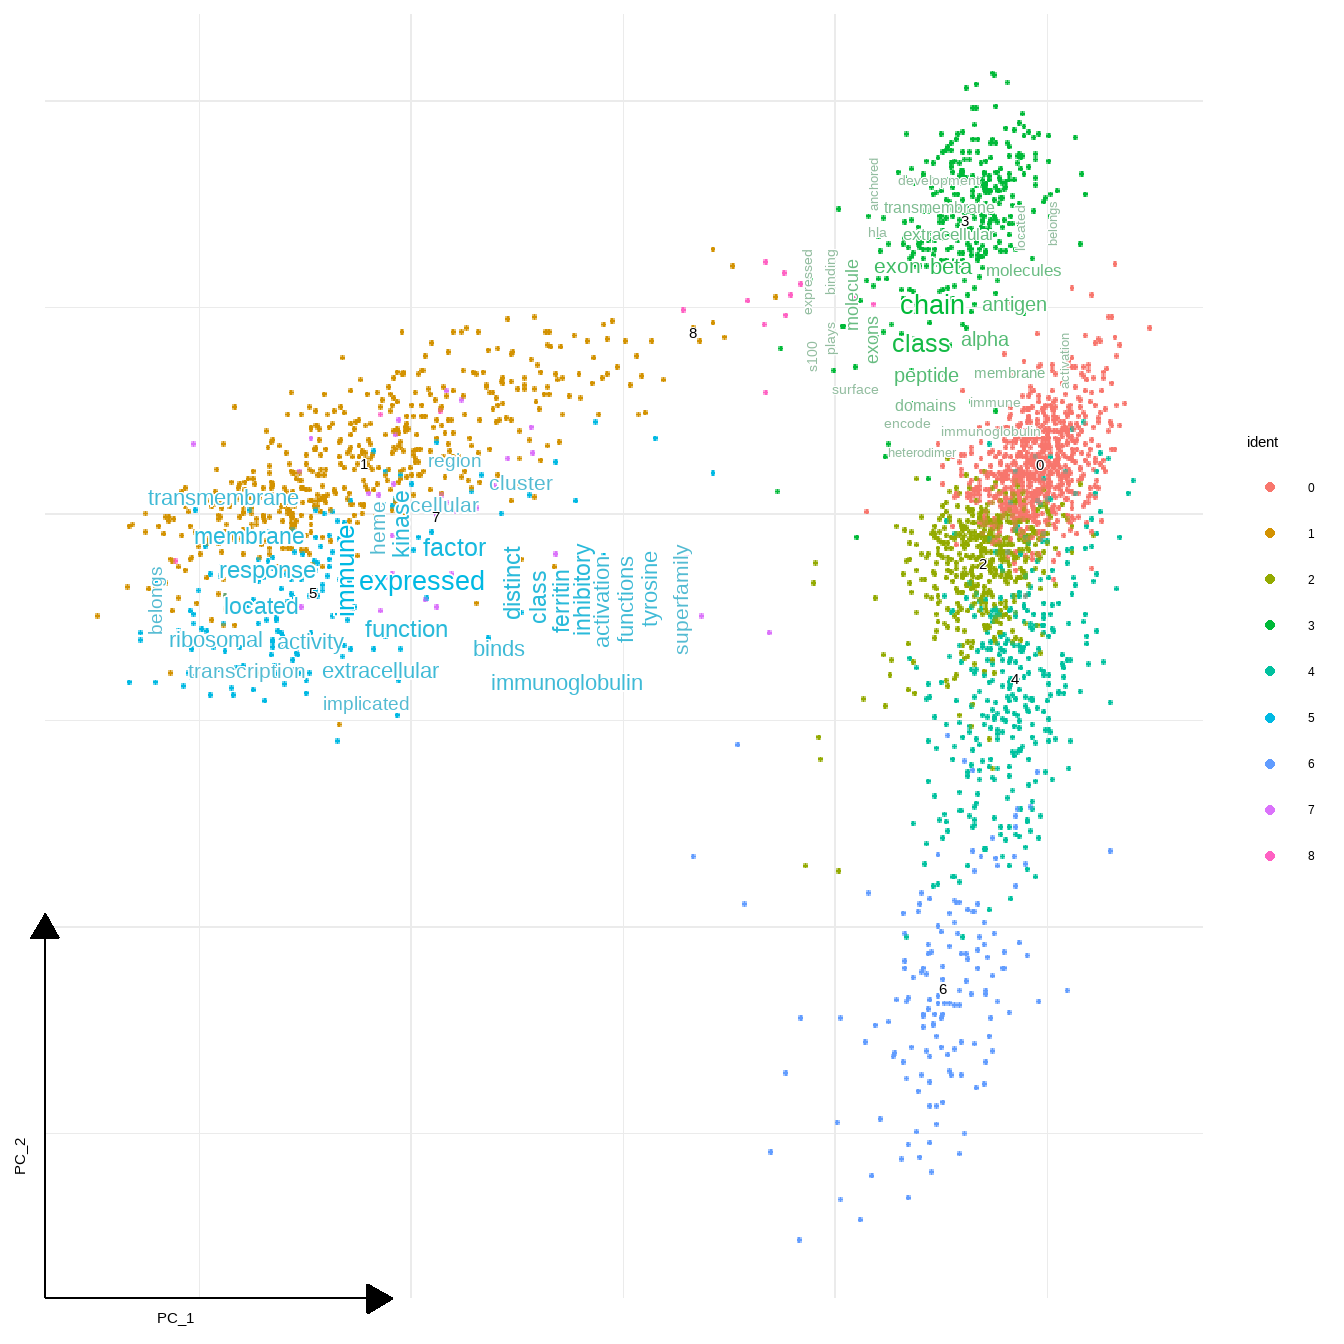
Some positioning arguments are prepared.
sc_dim(pbmc,reduction = "pca")+
  geom_sc_wordcloud(markers, show_markers = c(4,7),
    p_val_adj_threshold = 1e-50,
    wcScale=7,
    base_dens=TRUE)
#> 4
#> Input genes: 16
#>   Converted input genes: 16
#> Filter based on GeneSummary
#> Filtered 77 words (frequency and/or tfidf)
#> 7
#> Input genes: 9
#>   Converted input genes: 8
#> Filter based on GeneSummary
#> Filtered 77 words (frequency and/or tfidf)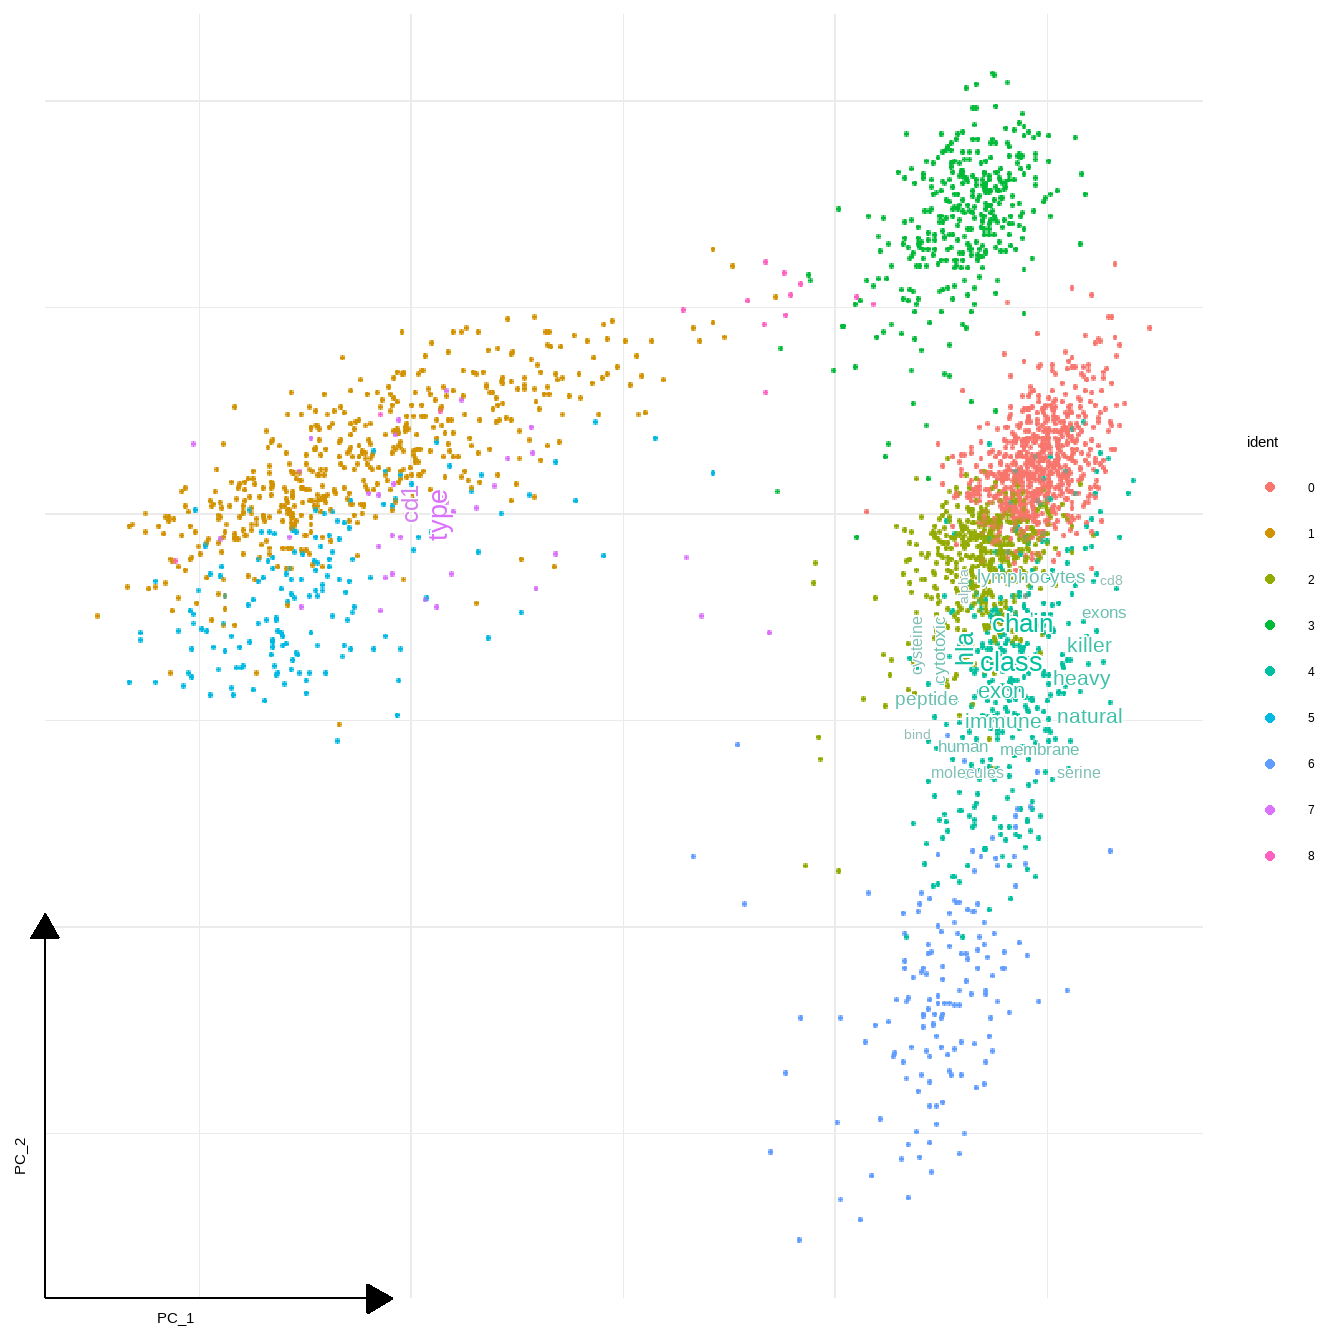
8.4 Plotting marker gene names in plot
You can plot gene names instead of gene description by specifying gene_name=TRUE in geom_sc_wordcloud(). Number of genes can be controlled with geneNum. The genes in each cluster are ordered by sortBy, in decreasing order in default (decreasing option).
sc_dim(pbmc,reduction = "pca")+
    geom_sc_wordcloud(markers, show_markers = c(0,5),
        gene_name = TRUE, wcScale=7,
        p_val_adj_threshold = 1e-50, base_dens = TRUE)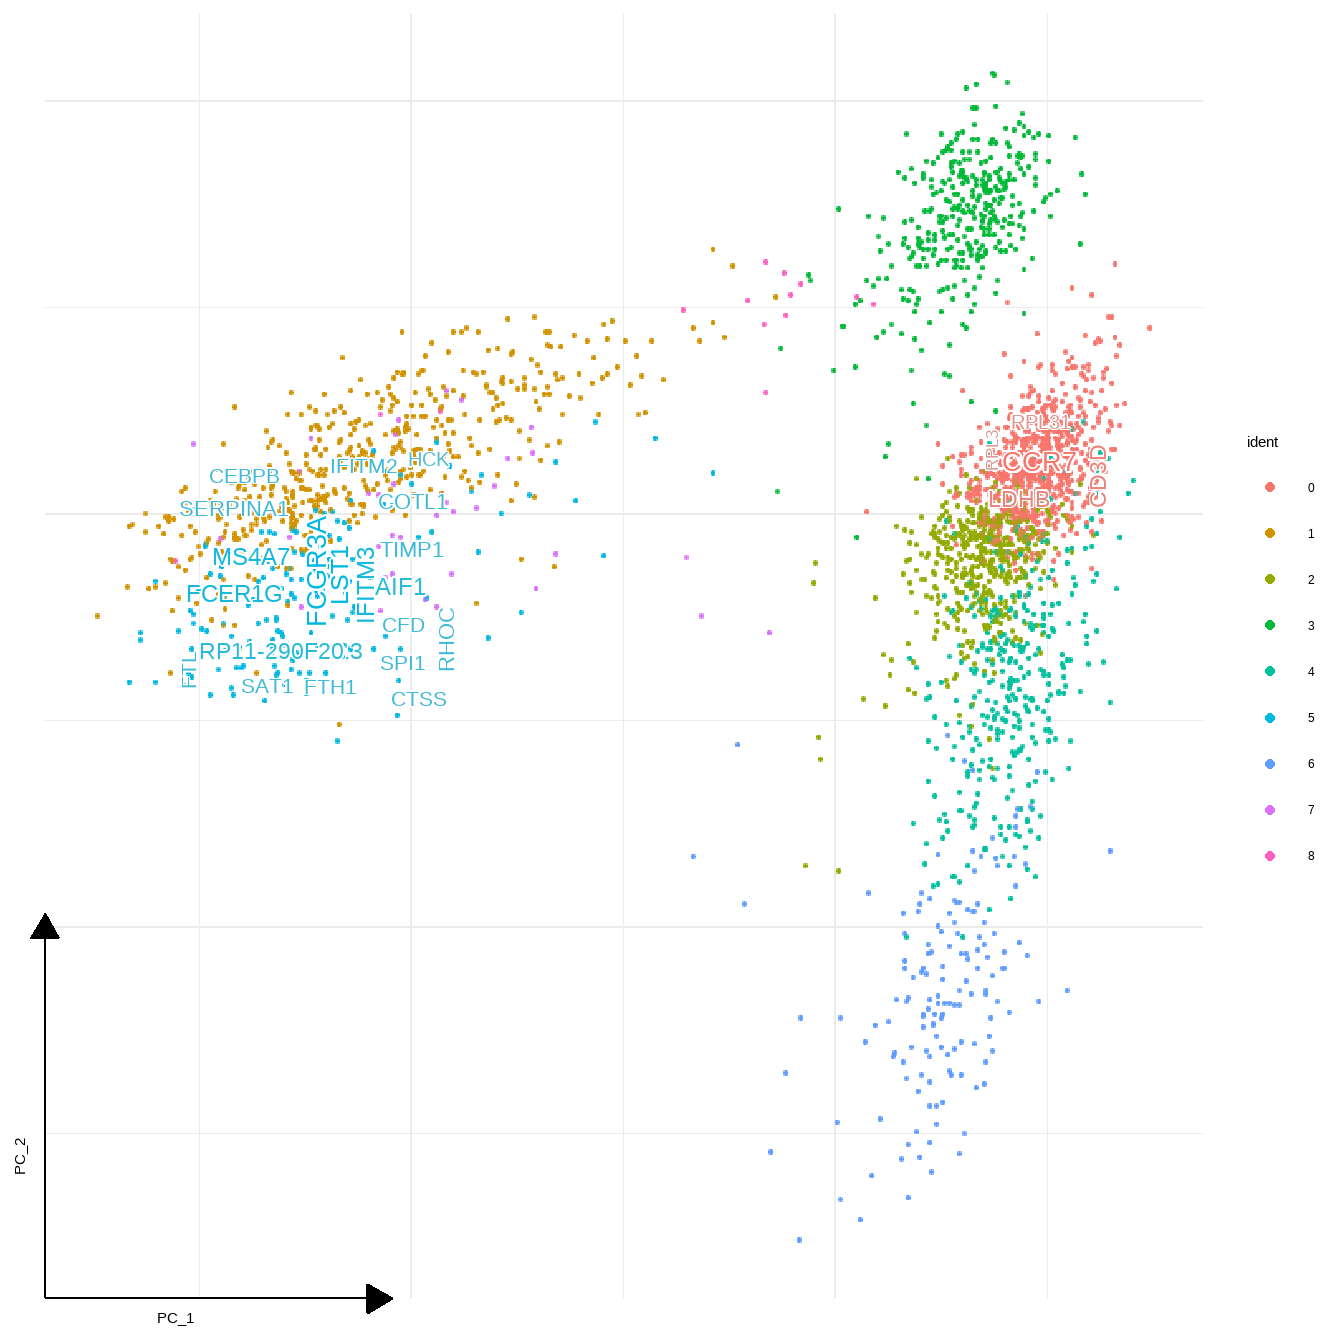
sc_dim(pbmc,reduction = "pca")+
    geom_sc_wordcloud(markers, show_markers = c(0,5),
        gene_name = TRUE, wcScale=7, use_shadowtext=FALSE,
        withggfx="with_outer_glow", ggfxParams=list(colour="white", expand=1.5),
        p_val_adj_threshold = 1e-50, base_dens = TRUE)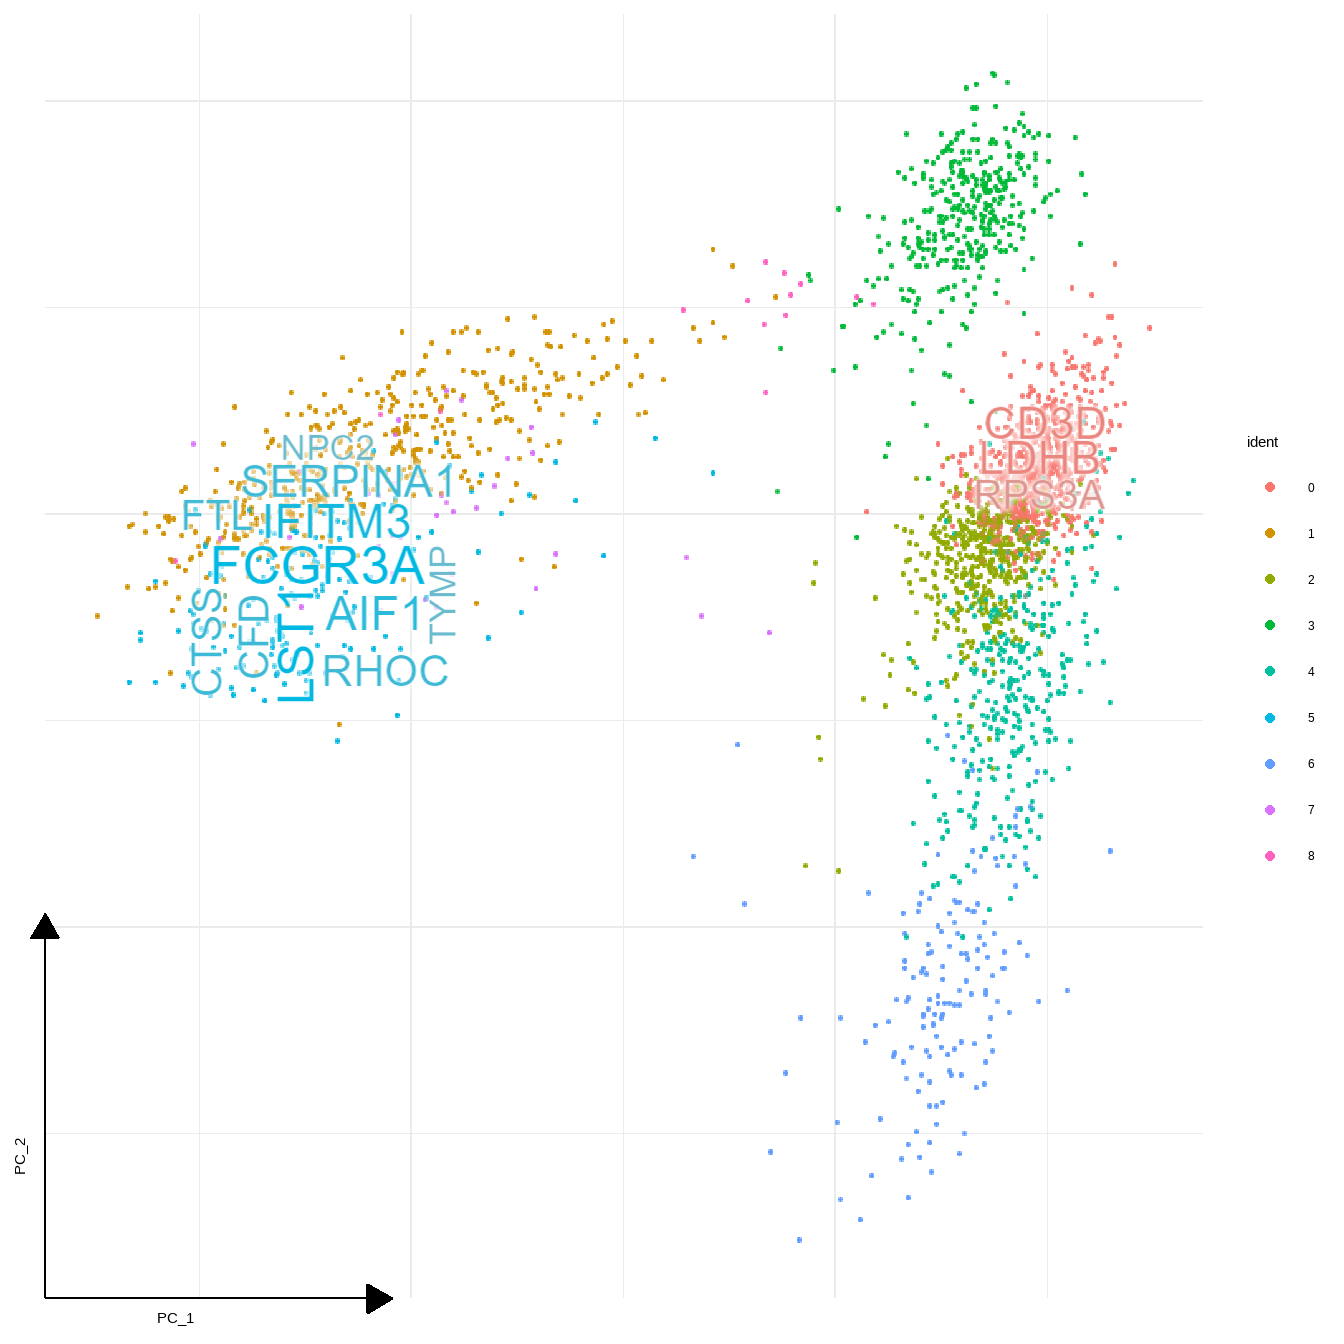
Scaling color should be called before geom_sc_wordcloud().
sc_dim(pbmc,reduction = "pca")+
    scale_color_manual(values=RColorBrewer::brewer.pal(9, "PuOr"))+
    geom_sc_wordcloud(markers, show_markers = c(0,5),
        gene_name = TRUE, wcScale=7,
        p_val_adj_threshold = 1e-50, base_dens = TRUE)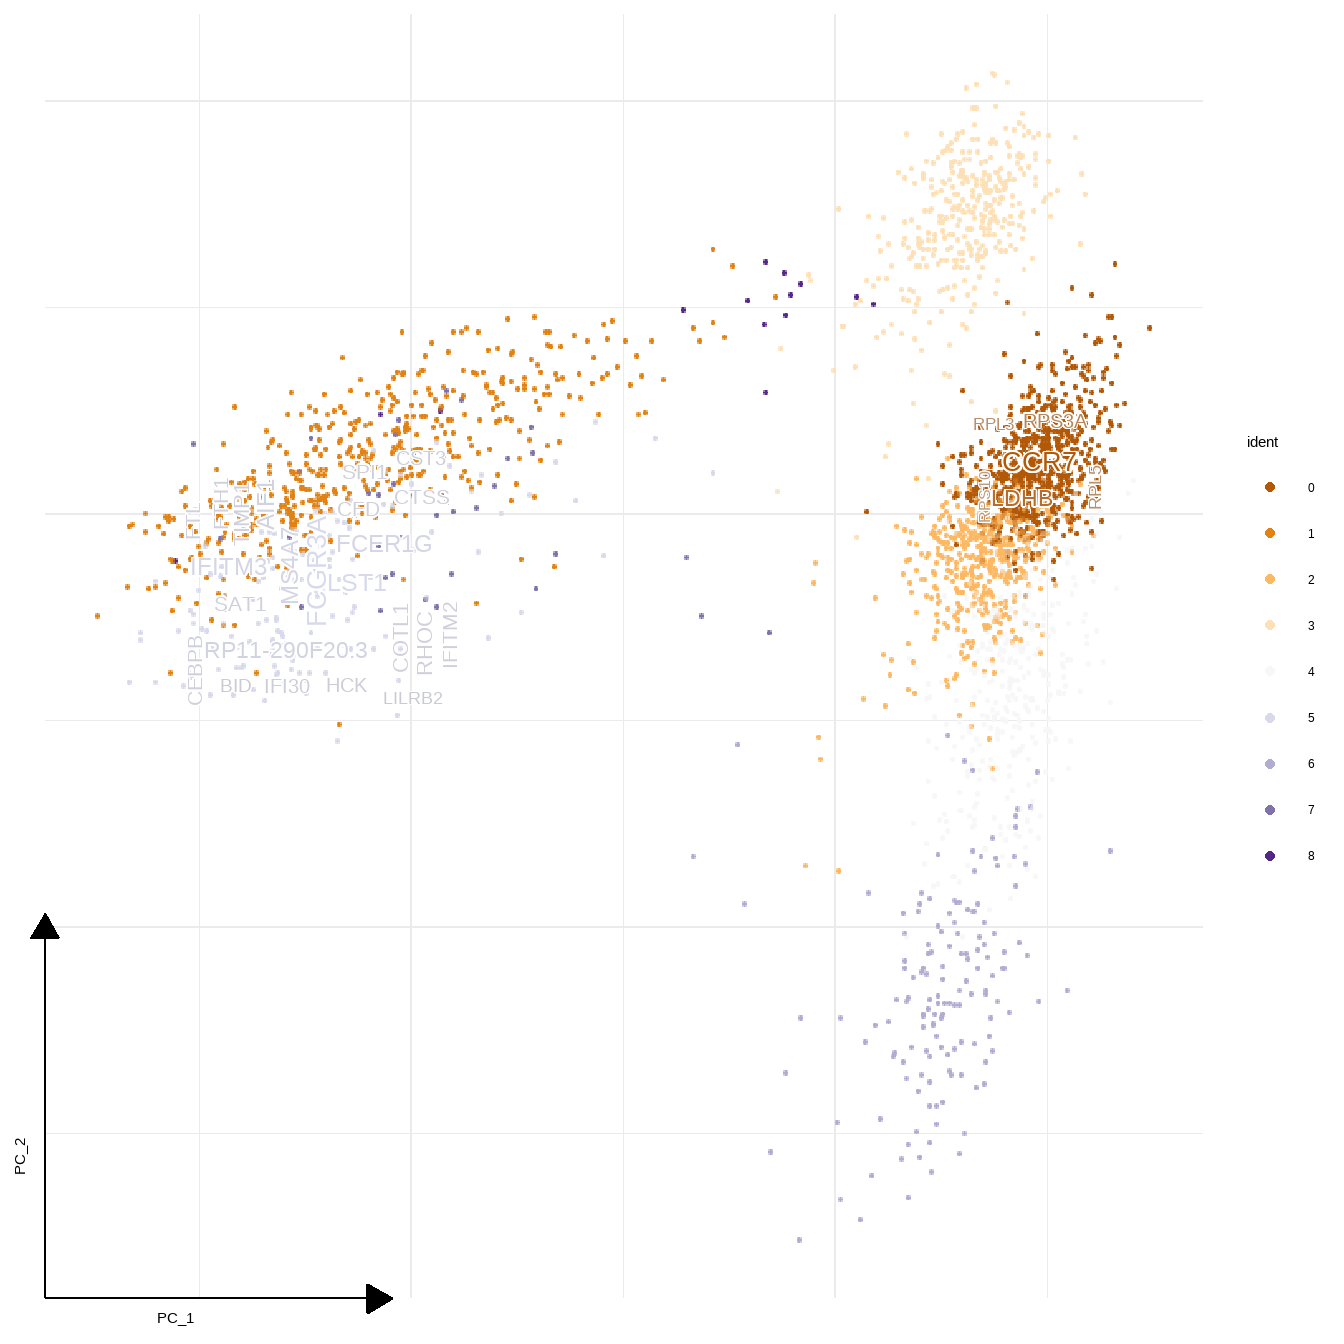
8.4.1 Plotting the enrichment analysis results of marker genes
r <- rep(3, length(unique(markers$cluster)))
names(r) <- unique(markers$cluster)

## Enrichment analysis
DimPlotWithTexts(pbmc, thresh, label=FALSE,
    point_alpha = 0.8,which.label = c(0,6),
    args=list(enrich="kegg", scaleFreq=10, numWords=50),
    reduction = "pca", base_dens=TRUE,
    wcScale=7)
#> 0
#> Input genes: 75
#>   Converted input genes: 75
#> Performing enrichment analysis
#> Filter based on GeneSummary
#> Filtered 77 words (frequency and/or tfidf)
#> 6
#> Input genes: 40
#>   Converted input genes: 39
#> Performing enrichment analysis
#> Filter based on GeneSummary
#> Filtered 77 words (frequency and/or tfidf)