3 Microbial functional analysis
In this section, we introduce making word networks showing microbial function using taxonomic idenfiers as input. For mining the pathway information in curated database MetaCyc (Caspi et al. 2020), users can prepare pathways.dat from MetaCyc flat files. Note that you must have a valid license of using MetaCyc. See User guides of MetaCyc, and BioCyc. The other options will be KEGG Pathway textual information.
Suppose we would like to know pathway and related information of “Bifidobacterium longum” and “Escherichia coli”. The function parseMetaCycPathway can be used to parse the summarized comment of pathways using these queries. Note that the function search for TAXONOMIC-RANGE or SPECIES information in pathways.dat if withTax=TRUE. The resulting data.frame looks like below.
For selecting species investigated, you can use your own dataset or the database such as BugSigDB, described in the section 4.1.
library(biotextgraph)
library(ggraph)

## Two species selected
candidateSpecies <- c("Staphylococcus aureus","Escherichia coli")

## Downloaded pathway description file
file <- "../../metacyc/24.5/data/pathways.dat"

input <- parseMetaCycPathway(file, candidateSpecies)
head(input, n=1) |> dplyr::select(!text) |> kableExtra::kable()| pathwayID | commonName | query |
|---|---|---|
| PWY-7622 | UDP-α-D-galactofuranose biosynthesis | Escherichia coli |
input2 <- parseMetaCycPathway(file, candidateSpecies, withTax=TRUE)
head(input2, n=1) |> dplyr::select(!text) |> kableExtra::kable()| pathwayID | commonName | species | taxonomicRange | query |
|---|---|---|---|---|
| PWY-7622 | UDP-α-D-galactofuranose biosynthesis | TAX-746128,TAX-330879,TAX-162425 | TAX-6231,TAX-3052,TAX-147538,TAX-5654,TAX-2 | Escherichia coli |
You can strip some tags and symbols in the text by clear=TRUE.
input3 <- parseMetaCycPathway(file, candidateSpecies, withTax=TRUE, clear=TRUE)
## Not shown because of the long text
These data frames can be passed to manual function, which performs the same analysis as RefSeq or PubMed information. The input data frame has to have "text" column to make word cloud or a network.
## Set remove words
remove_words <- c("cits","frame","pathway","gene","genes")

metawc <- manual(input3, plotType="wc",
                additionalRemove=remove_words,
                numWords=100,
                 argList=list(
                   rot.per=0.4,
                   colors=RColorBrewer::brewer.pal(8, "Set2"),
                   random.order=FALSE
                 ))
metawc
#> Type: manual
#> Number of words: 100
#> Query:
#> 526 Kb
plotWC(metawc, asis=TRUE)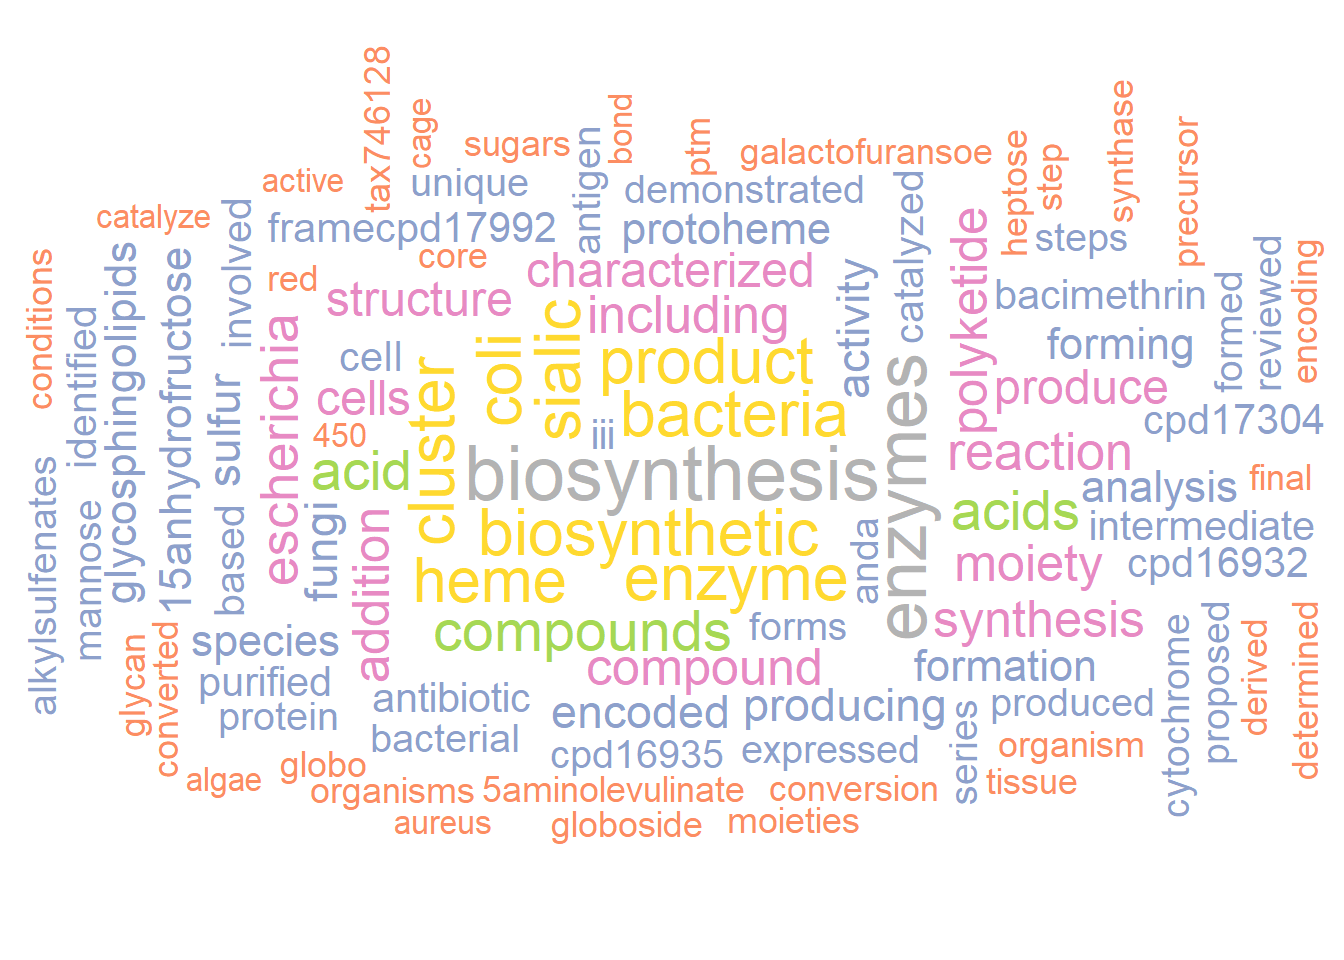
For plotting the network, query column must be specified if plotting the query with the word information.
metanet <- manual(input[,c("query","text")],
                  additionalRemove=remove_words,
                  numWords=40, colorText=TRUE)
#> Ignoring corThresh, automatically determine the value
#> threshold = 0.4
metanet
#> Type: manual
#> Number of words: 40
#> Query:
#> Graph: V(40), E(95)
#> Degree: acids(8)/cluster(8)/enzyme(8)/sialic(8)/addition(7)
#> 560.8 Kb
plotNet(metanet, asis=TRUE)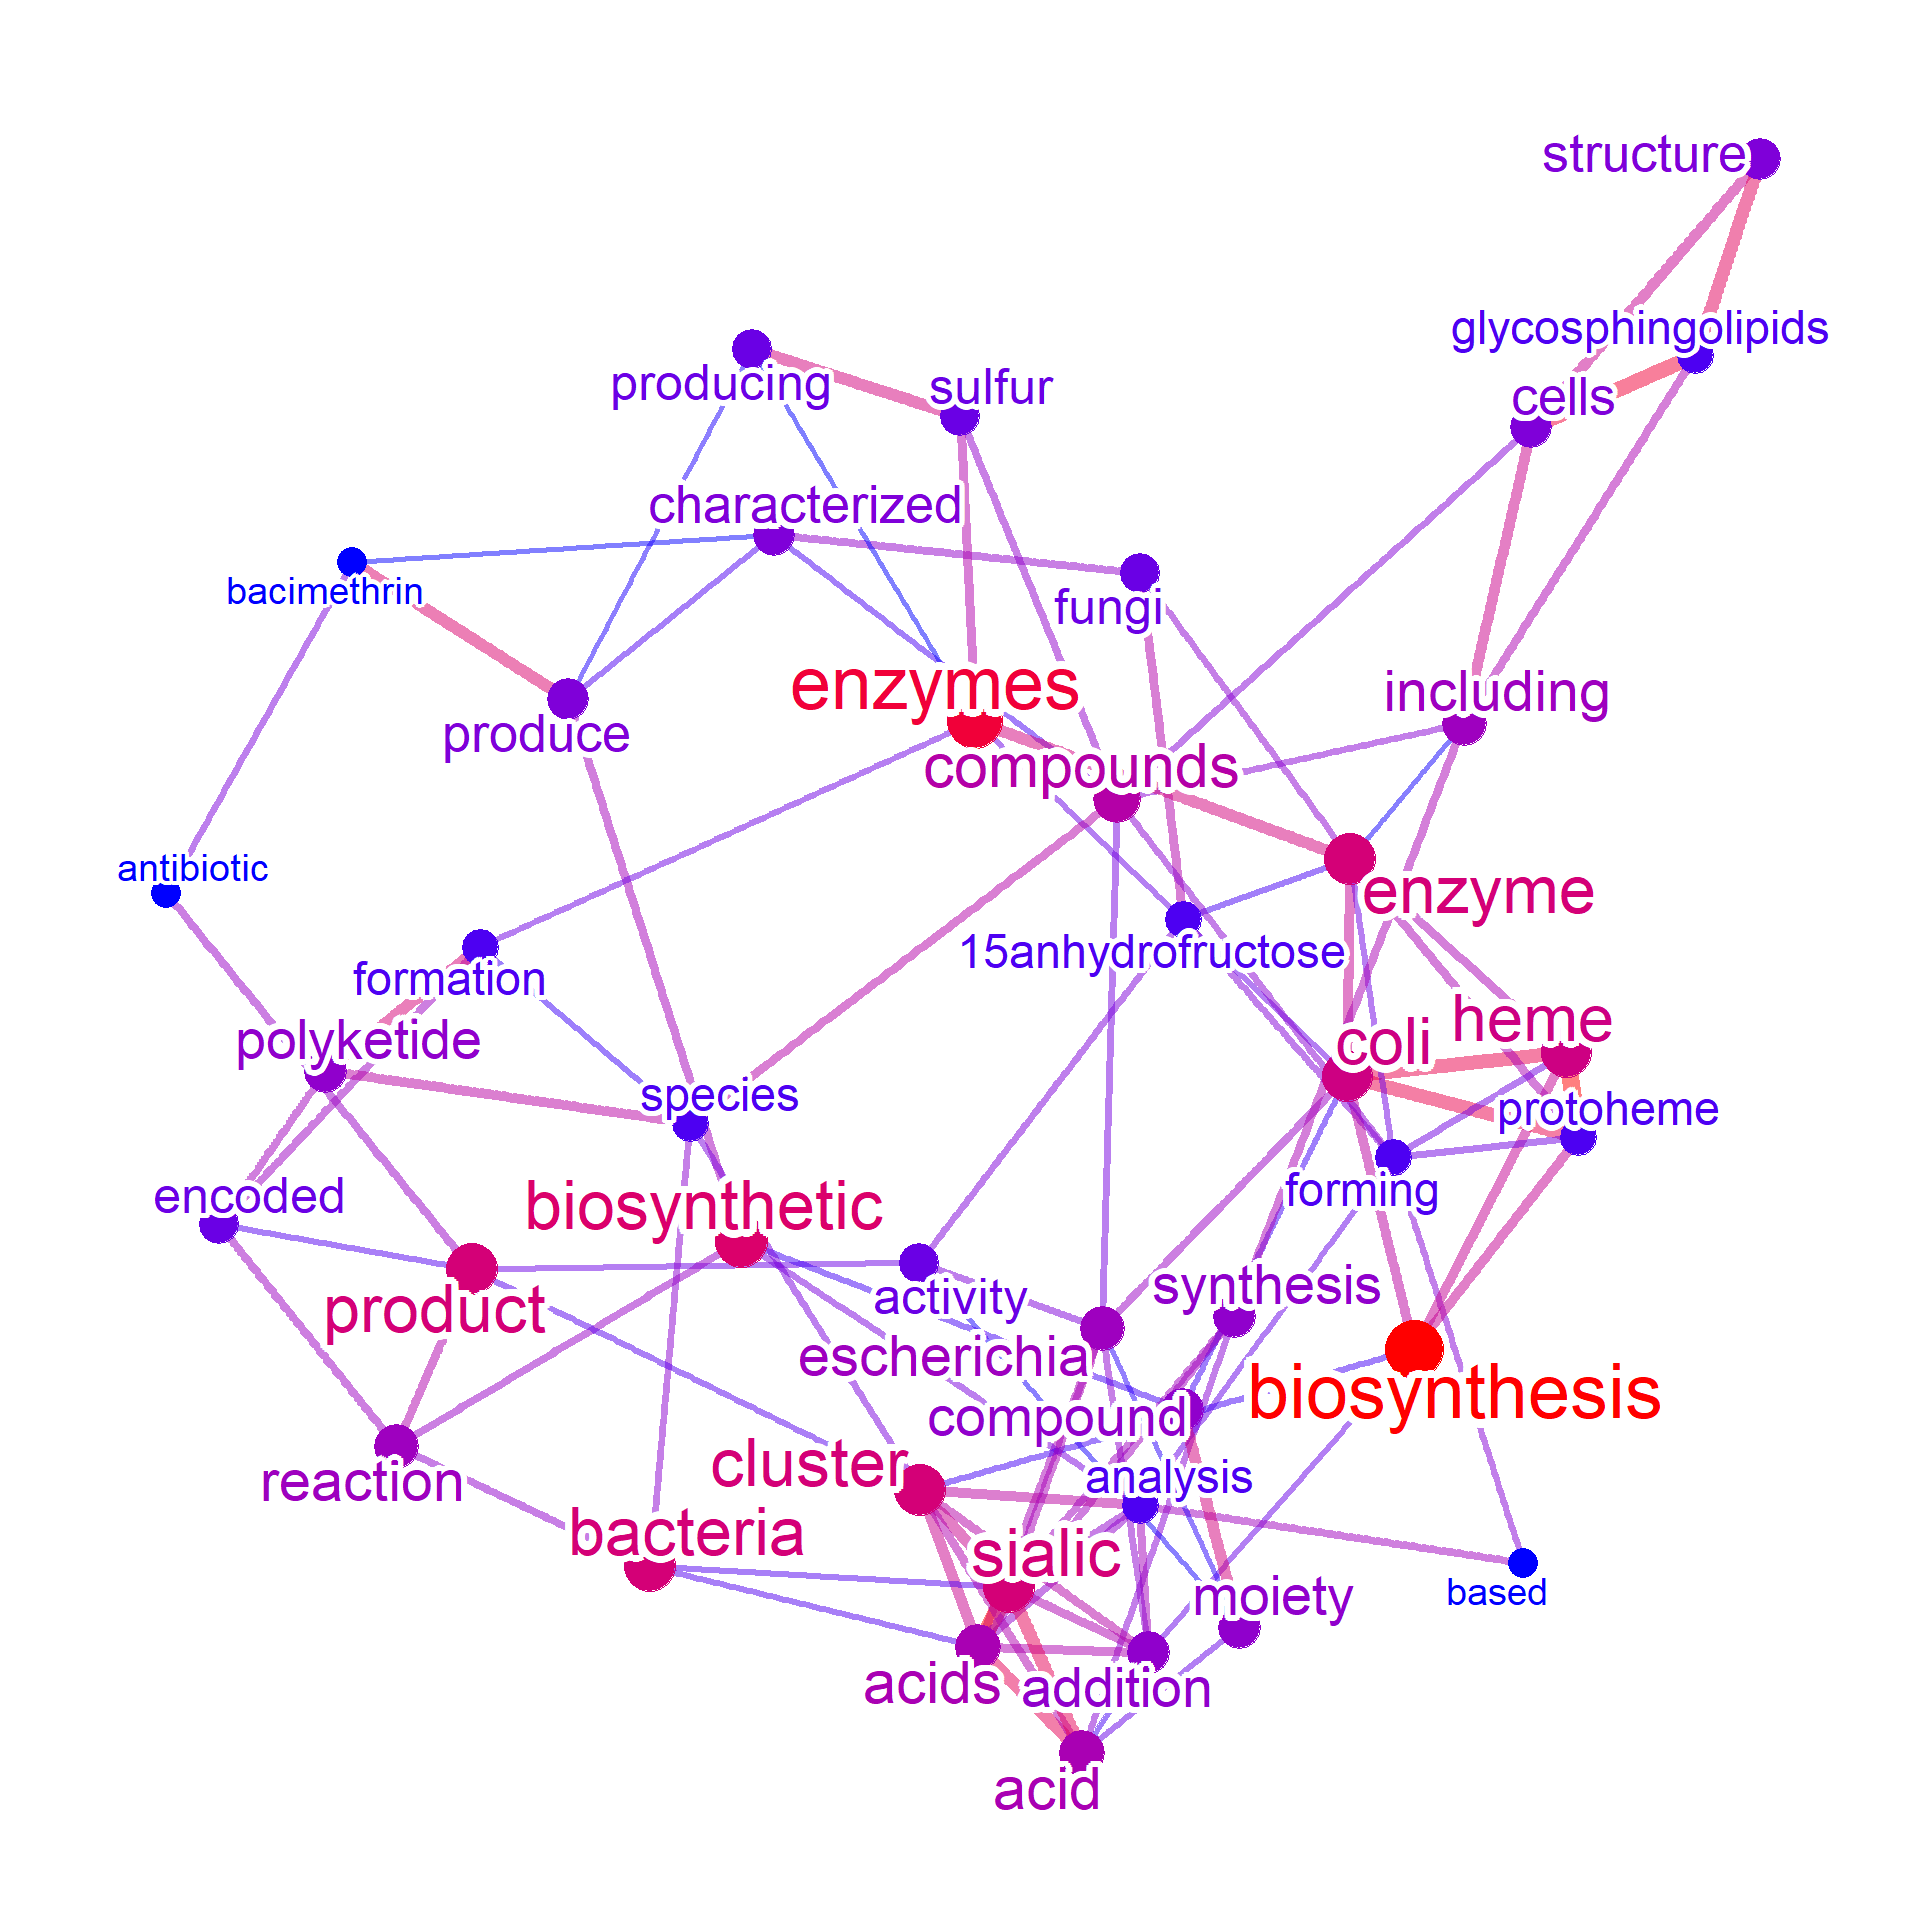
For column other than the query and text, in this example commonName and pathwayID, the relationship between query and these columns are to be plotted. In this example, the connection between query and text is not shown because queryPlot is FALSE.
metanet2 <- manual(input[,c("query","text")],
                   layout="kk", edgeLink=FALSE,
                   additionalRemove=remove_words,
                   numWords=20, colorText=TRUE,
                   queryPlot=TRUE, ngram=2)
#> Ignoring corThresh, automatically determine the value
#> threshold = 0.2
metanet2
#> Type: manual
#> Number of words: 20
#> Query:
#> Graph: V(22), E(110)
#> Degree: Escherichia coli(41)/escherichia coli(22)/biosynthetic cluster(15)/coli purified(13)/staphylococcus aureus(13)
#> 830.2 Kb
plotNet(metanet2, asis=TRUE)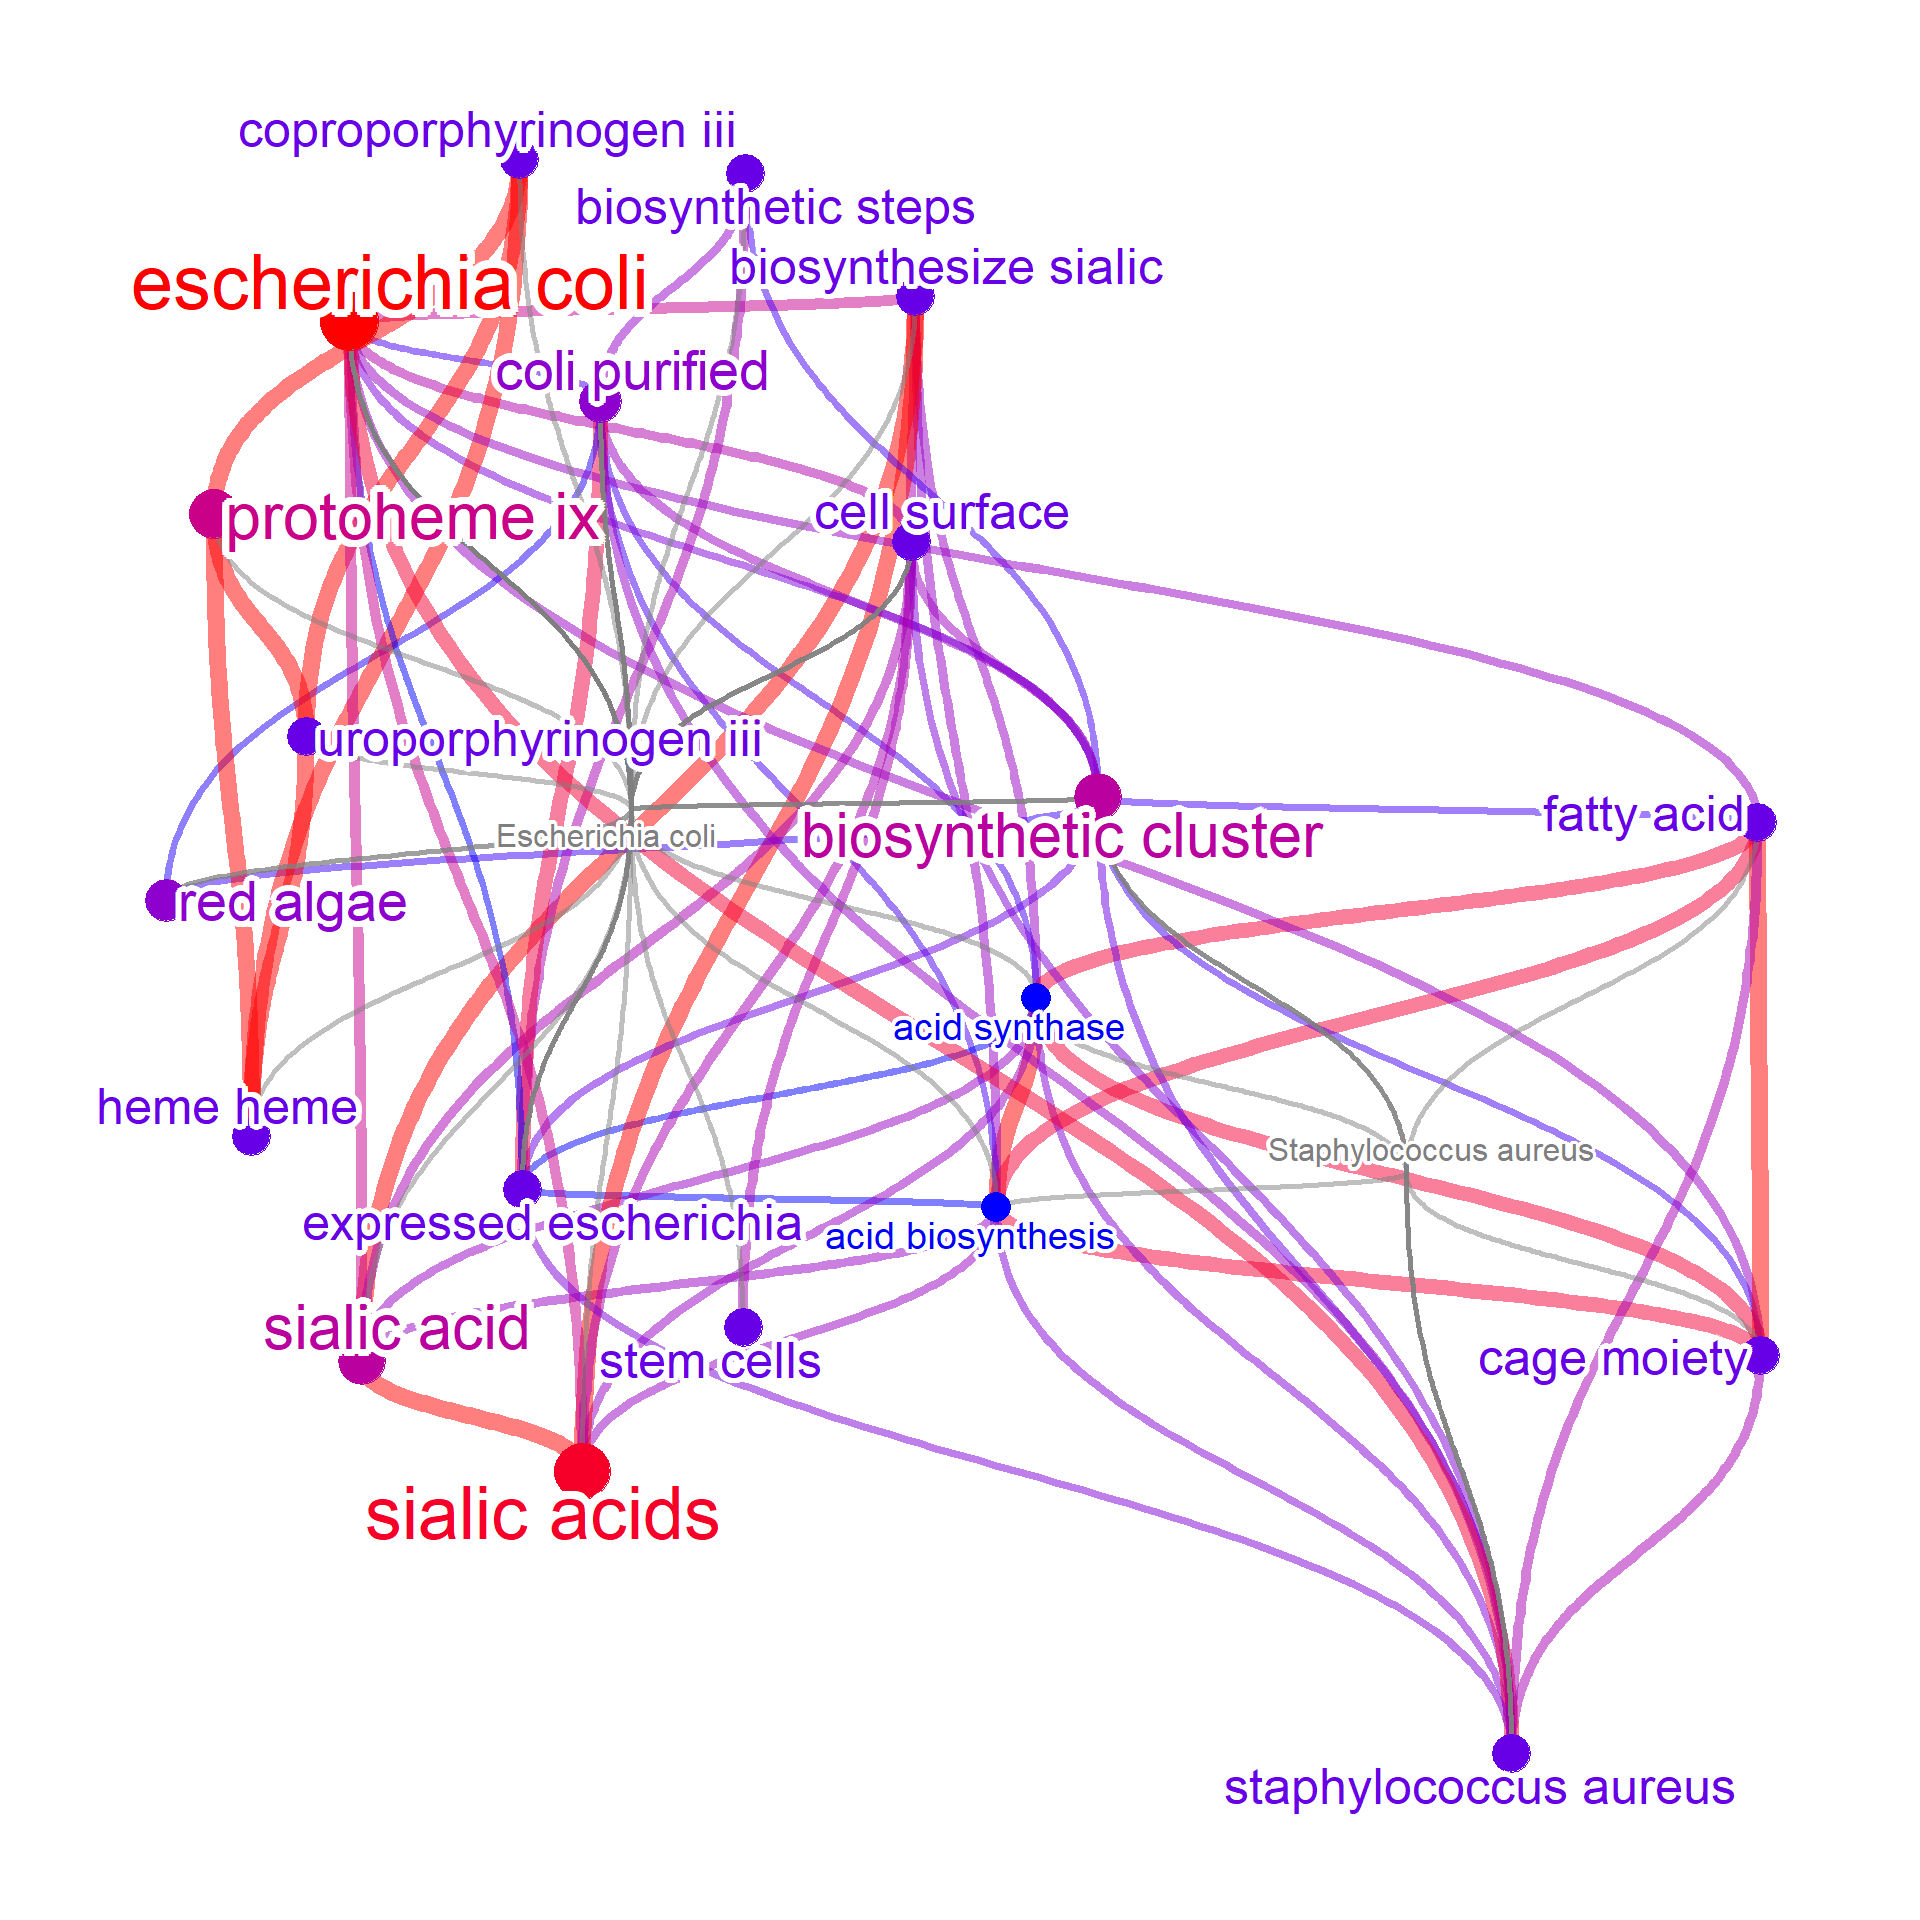
When taxonomy parsing is available, query by the NCBI Taxonomy ID.
# Set candSp to all and noComma to TRUE
input <- parseMetaCycPathway(file, candSp="all", withTax = TRUE, noComma=TRUE)

input2 <- input[grepl("TAX-2157",input$taxonomicRange),]
input2 <- input2[!duplicated(input2$pathwayID),]
onlyText <- data.frame(input2[,c("text")]) |> `colnames<-`(c("text"))
input2Net <- manual(onlyText, additionalRemove=c("cits","frame",
                       "gene","genes","proteins",
                       "pathway","pathways","enzyme","enzymes",
                       "bacteria","reaction","protein","biosynthesis",
                       "organism","organisms"))
#> Ignoring corThresh, automatically determine the value
#> threshold = 0.1
plotNet(input2Net, asis=TRUE)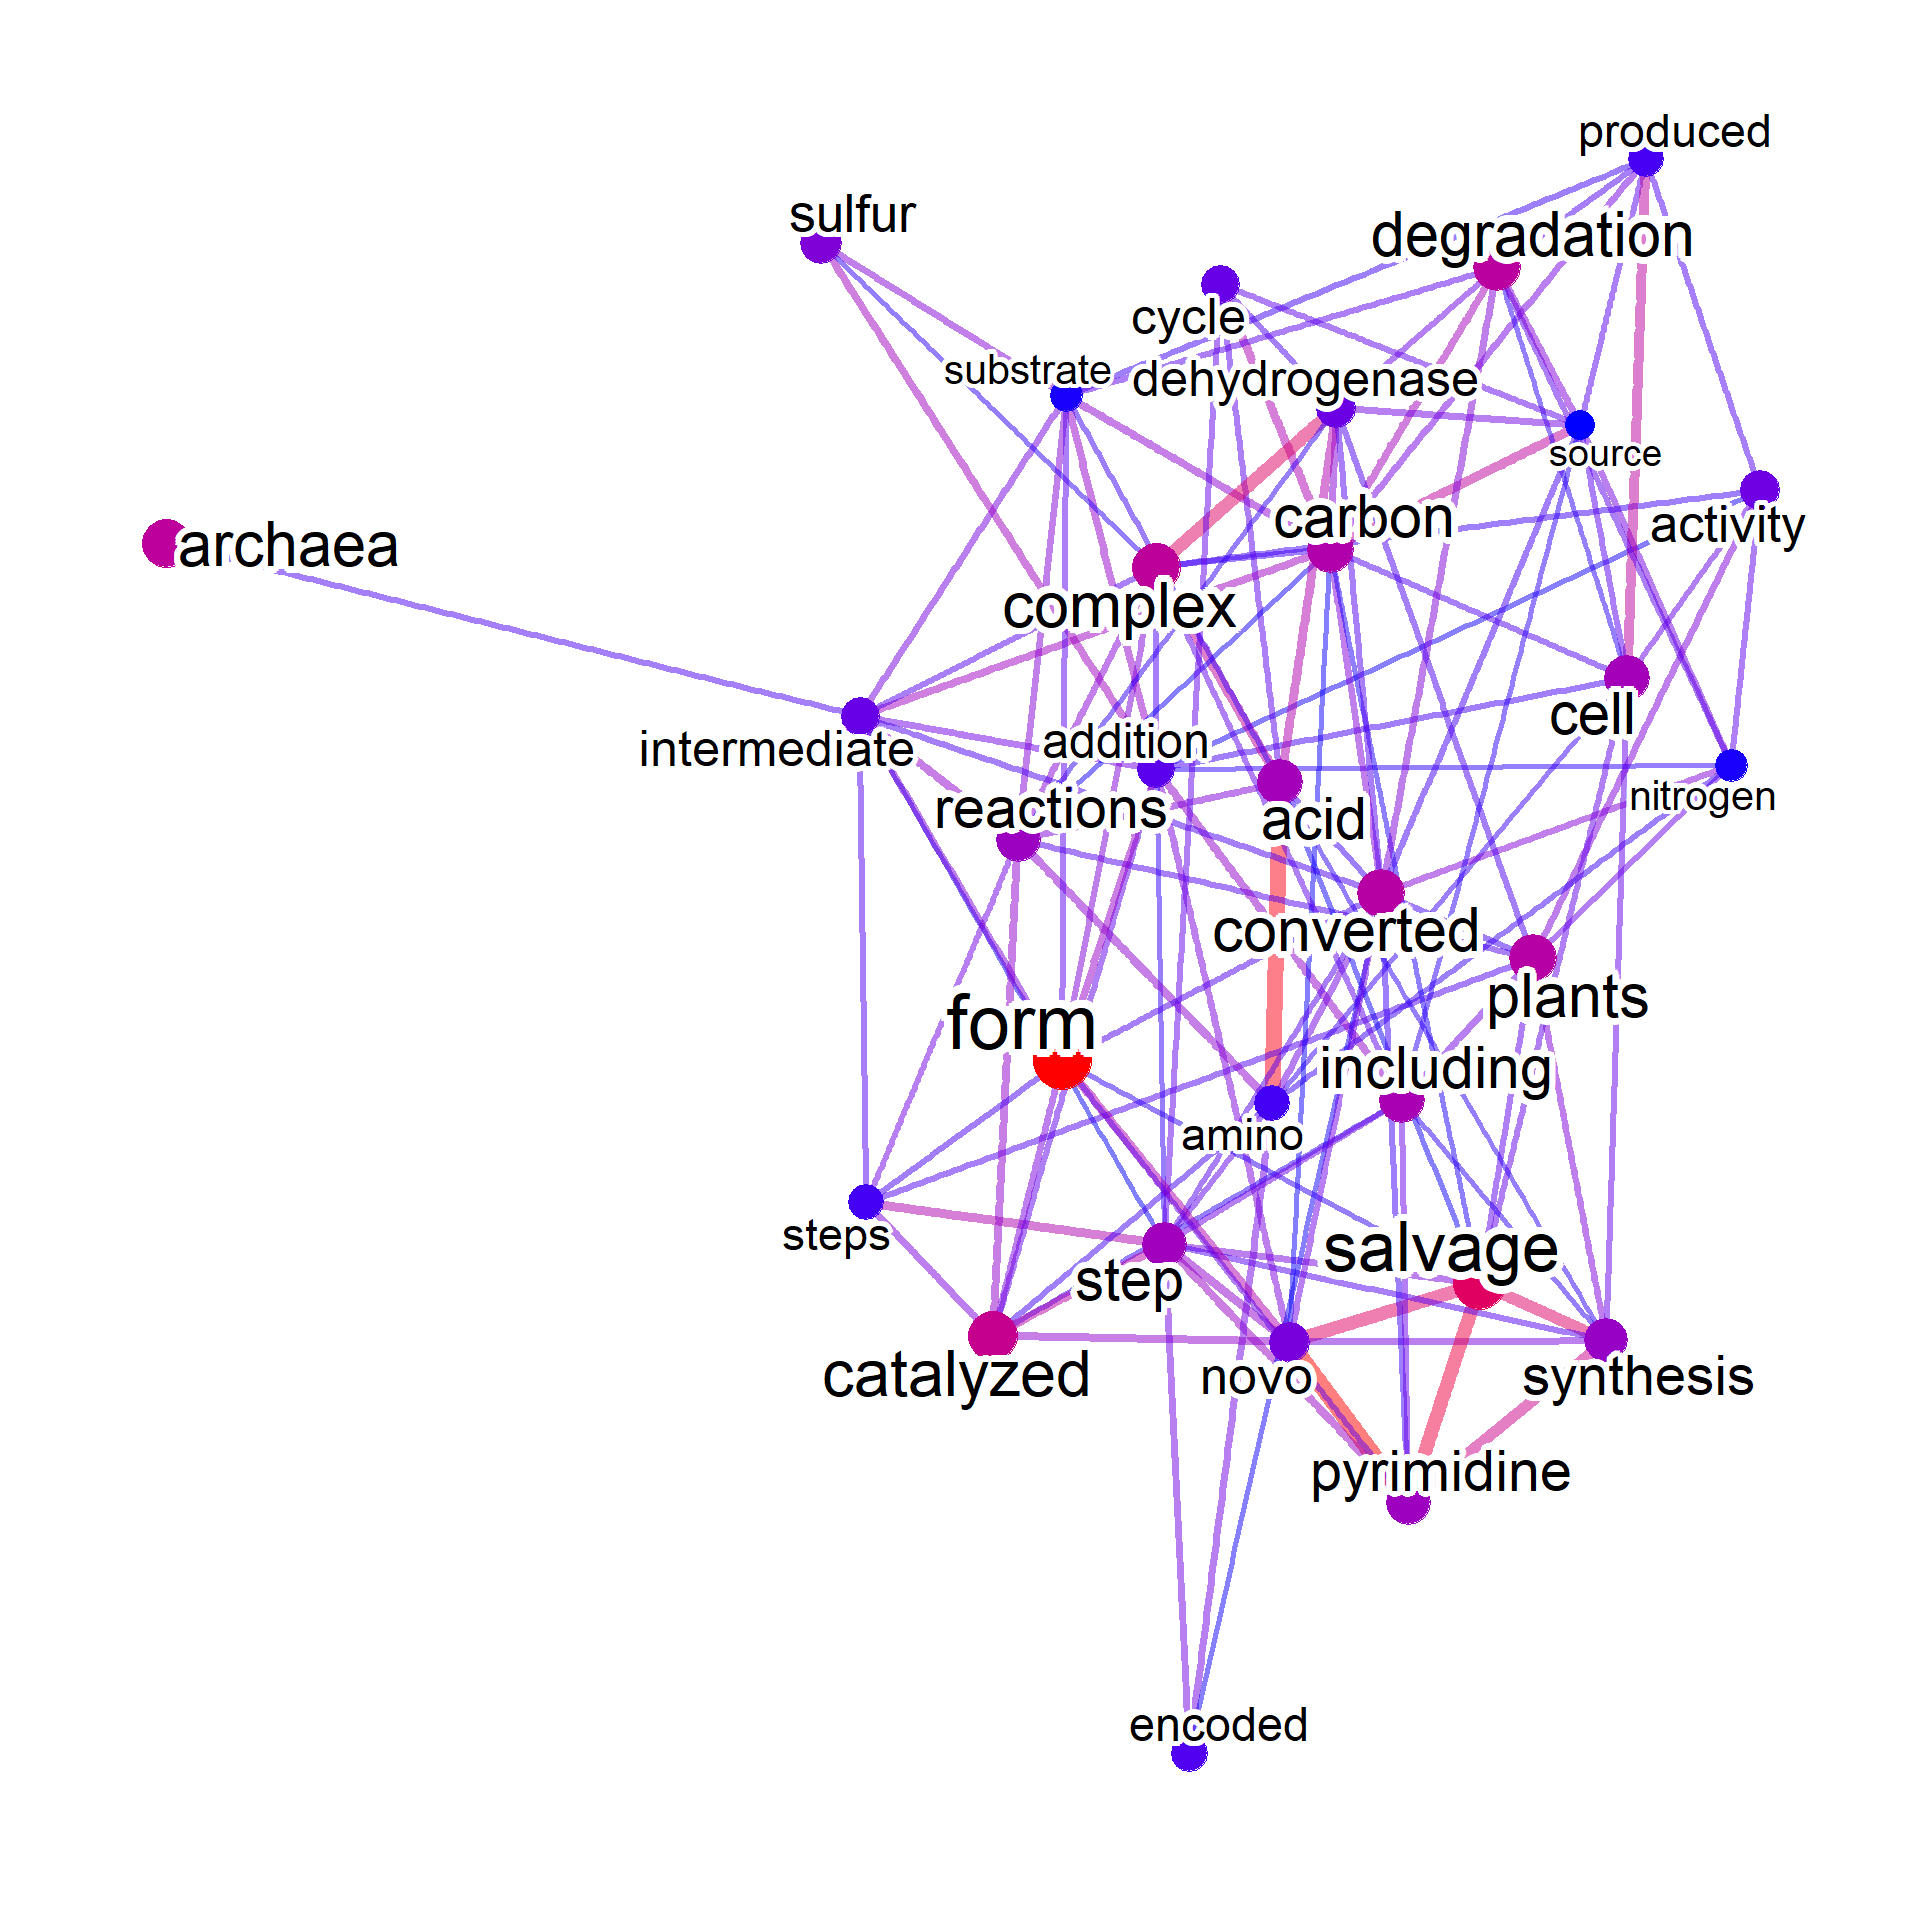
Also, if you want to search for the NCBI taxonomy identifiers and want to use species names as queries, First you should convert the IDs using convertMetaCyc function using taxonomizr.
Next you search for converted names for the interested species, and input this data frame to manual.
input$converted <- convertMetaCyc(input$species)
input3 <- input[grepl("Bifidobacterium",input$converted),]
input3 <- input3[!duplicated(input3$pathwayID),]
input3$query <- rep("Bifidobacterium",nrow(input3))
input3 <- input3[,c("text","pathwayID","query")]
input3Net <- manual(input3, plotType="network", queryPlot=TRUE,
                    layout="lgl", edgeLink=FALSE, tag="cor",
                    additionalRemove=c("cits","frame",
                                       "gene","genes","proteins",
                                       "pathway","pathways","enzyme","enzymes",
                                       "bacteria","reaction","protein","biosynthesis",
                                       "organism","organisms"))
#> Bootstrap (r = 0.5)... Done.
#> Bootstrap (r = 0.6)... Done.
#> Bootstrap (r = 0.7)... Done.
#> Bootstrap (r = 0.8)... Done.
#> Bootstrap (r = 0.9)... Done.
#> Bootstrap (r = 1.0)... Done.
#> Bootstrap (r = 1.1)... Done.
#> Bootstrap (r = 1.2)... Done.
#> Bootstrap (r = 1.3)... Done.
#> Bootstrap (r = 1.4)... Done.
#> Ignoring corThresh, automatically determine the value
#> threshold = 0.8
#> Including columns pathwayID to link with query
plotNet(input3Net, asis=TRUE)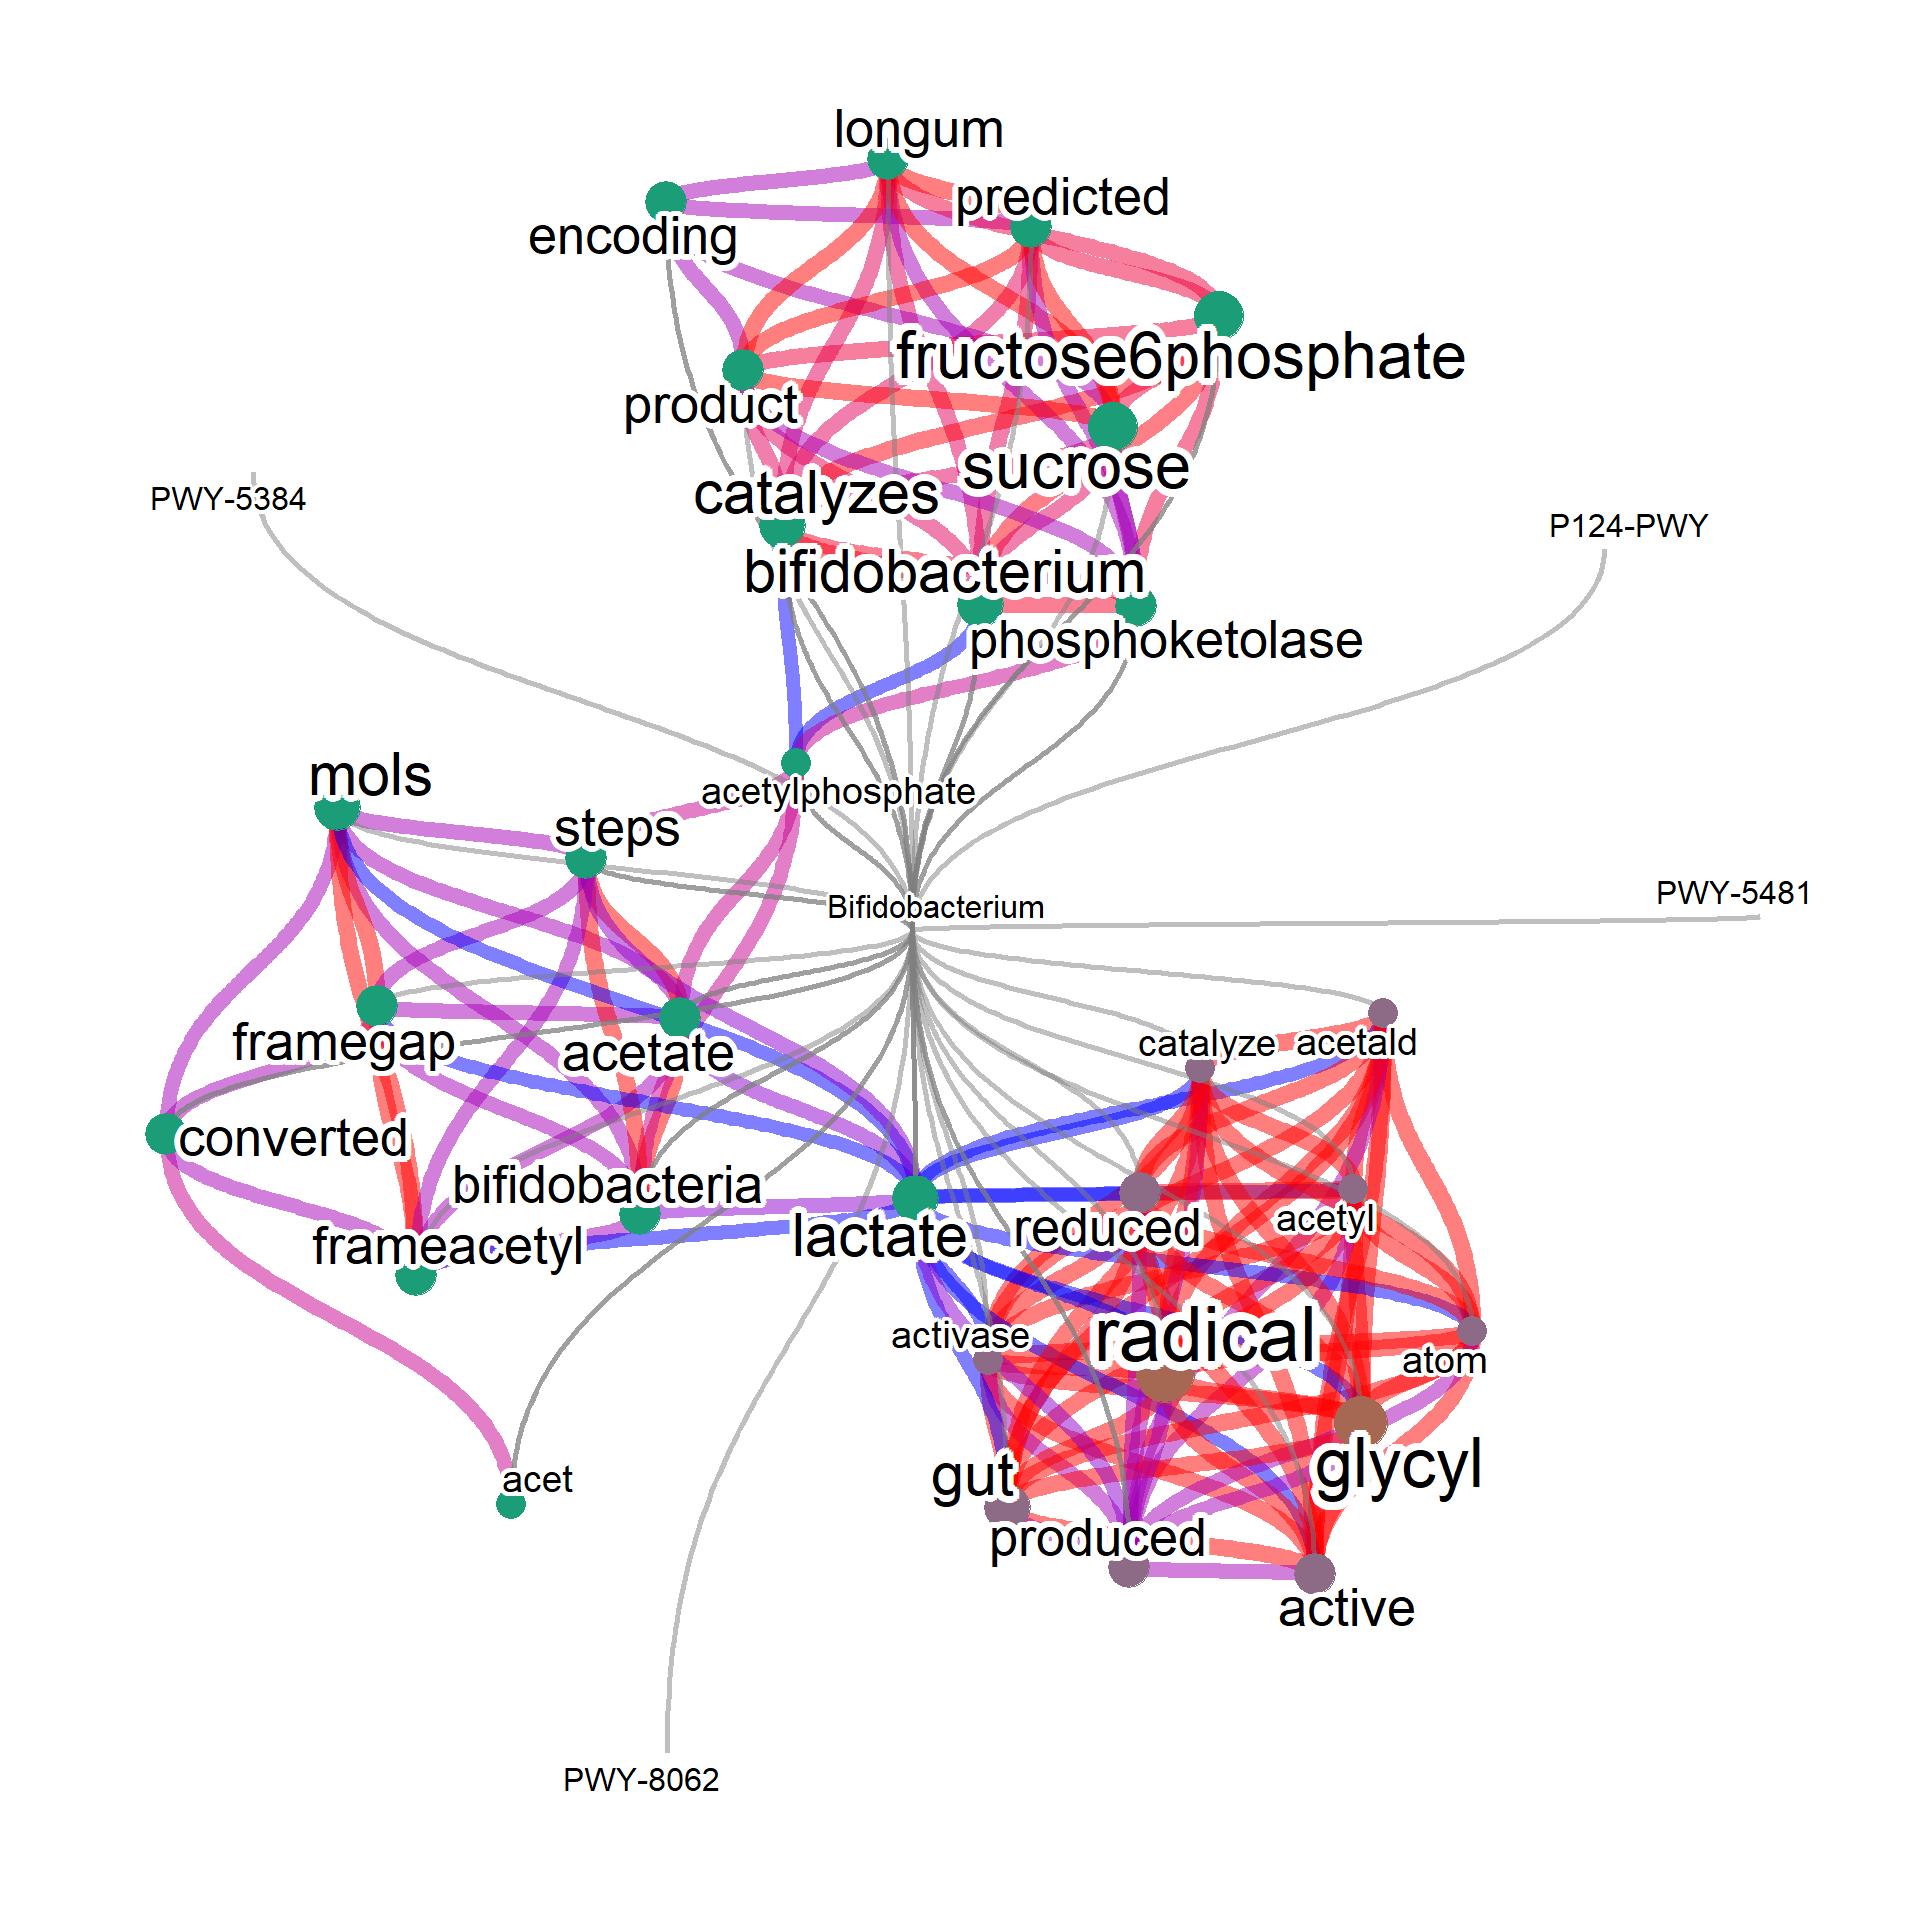
Includes BioCyc (TM) pathway/genome databases under license from SRI International.
sessionInfo()
#> R version 4.3.1 (2023-06-16 ucrt)
#> Platform: x86_64-w64-mingw32/x64 (64-bit)
#> Running under: Windows 11 x64 (build 22621)
#>
#> Matrix products: default
#>
#>
#> locale:
#> [1] LC_COLLATE=Japanese_Japan.utf8
#> [2] LC_CTYPE=Japanese_Japan.utf8
#> [3] LC_MONETARY=Japanese_Japan.utf8
#> [4] LC_NUMERIC=C
#> [5] LC_TIME=Japanese_Japan.utf8
#>
#> time zone: Asia/Tokyo
#> tzcode source: internal
#>
#> attached base packages:
#> [1] stats     graphics  grDevices utils     datasets
#> [6] methods   base
#>
#> loaded via a namespace (and not attached):
#>  [1] digest_0.6.33     R6_2.5.1          bookdown_0.35
#>  [4] fastmap_1.1.1     xfun_0.40         cachem_1.0.8
#>  [7] knitr_1.44        memoise_2.0.1     htmltools_0.5.6
#> [10] rmarkdown_2.25    xml2_1.3.5        cli_3.6.1
#> [13] downlit_0.4.3     sass_0.4.7        withr_2.5.0
#> [16] jquerylib_0.1.4   compiler_4.3.1    rstudioapi_0.15.0
#> [19] tools_4.3.1       evaluate_0.21     bslib_0.5.1
#> [22] yaml_2.3.7        fs_1.6.3          jsonlite_1.8.7
#> [25] rlang_1.1.1