7 Fitting and comparing the parameters
7.1 strucValues function
After selecting the network, we can fit parameters for each of the arcs in the obtained networks. For this analysis, strucValues function is prepared. This function enables comparison of networks between groups by identifying the regulatory relationships of arcs for each cell and each group from SCT data. The function accepts the network (in bn or tbl_graph) and the SingleCellExperiment data. The labels should be specified for the interesting grouping.
set.seed(1)
library(scstruc)
sce <- mockSCE()
sce <- logNormCounts(sce)
included_genes <- sample(row.names(sce), 20)
gs <- scstruc(sce, included_genes, changeSymbol=FALSE)

sv <- strucValues(sce, labels=c("Treatment"), bn = gs$net)
#> Coefficient calculation per specified group: Treatment
head(sv)
#>        from        to coefficient Treatment
#> 1 Gene_0556 Gene_0816   0.3136802    treat1
#> 2 Gene_0017 Gene_0909   0.1301085    treat1
#> 3 Gene_0556 Gene_1647   0.2261649    treat1
#> 4 Gene_0695 Gene_1794  -0.2075066    treat1
#> 5 Gene_0017 Gene_1806  -0.2137052    treat1
#> 6 Gene_1827 Gene_1806   0.2607372    treat1
This returns the fitted parameters for each edge and the specified group.
7.2 plotSubNet
plotSubNet plots the network centered to the interesting genes based on the returned data.frame from strucValues. The plots were separated by the specified label.
library(ggraph)
plotSubNet(sv, sv$from[4], label = "Treatment")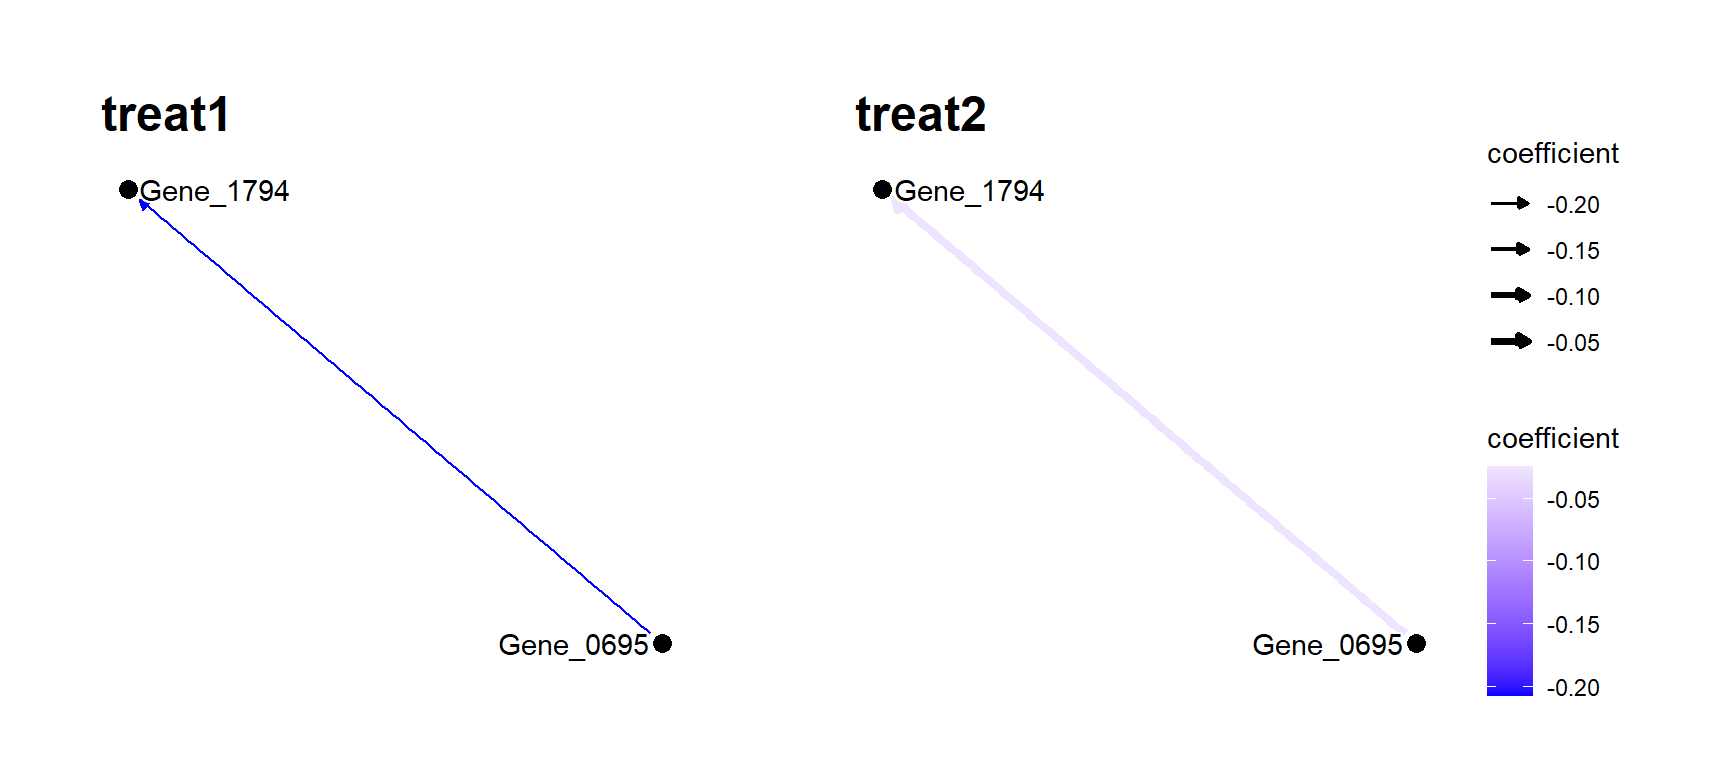
7.3 markerCoefs function
The marker arcs distinguishing between groups can be identified by the markerCoefs function. The function accepts the returned data.frame of strucValues.
marks <- markerCoefs(sv, classif_label =  "Treatment", cell_column = NULL, sample_column = "Treatment")
#> Performing Boruta algorithm ...
marks
#> [[1]]
#> Boruta performed 10 iterations in 0.3576541 secs.
#>  No attributes deemed important.
#>  7 attributes confirmed unimportant:
#> Gene_0017->Gene_0909, Gene_0017->Gene_1806,
#> Gene_0556->Gene_0816, Gene_0556->Gene_1647,
#> Gene_0695->Gene_1794 and 2 more;
#>
#> [[2]]
#> character(0)
cell_column and cell_label is used to subset the results based on the cell labels (i.e. obtained from the cell clustering and annotation). classif_label is used to specify the group of interest. sample_column should be specified additionally for the sample identifier information in group of interest.
The function by default uses Boruta algorithm for identifying the candidate arcs.
If xgboost argument is TRUE, the classification will be performed by the R package xgboost.
For analyses using other algorithms, the return_mat option allows the output of the matrix actually used for classification.