Chapter 4 bnpathplot
4.2 The vanilla plot
This function plots inferred relationship between pathways, with the boot-strapped strength between pathways. The normal plot can be plotted by bnpathplot, passing the results of clusterProfiler or ReactomePA, (normalized) expression values, and candidate rows to be included in the inference. nCategory specifies the number of categories (1:nCategory) to be plotted, sorted by the p-value. expRow indicates what identifiers are used in row names of expression matrix.
bnpathplot(results = pway,
           exp = vsted,
           expSample = incSample,
           nCategory = 30,
           R = 10,
           labelSize=5,
           expRow = "ENSEMBL")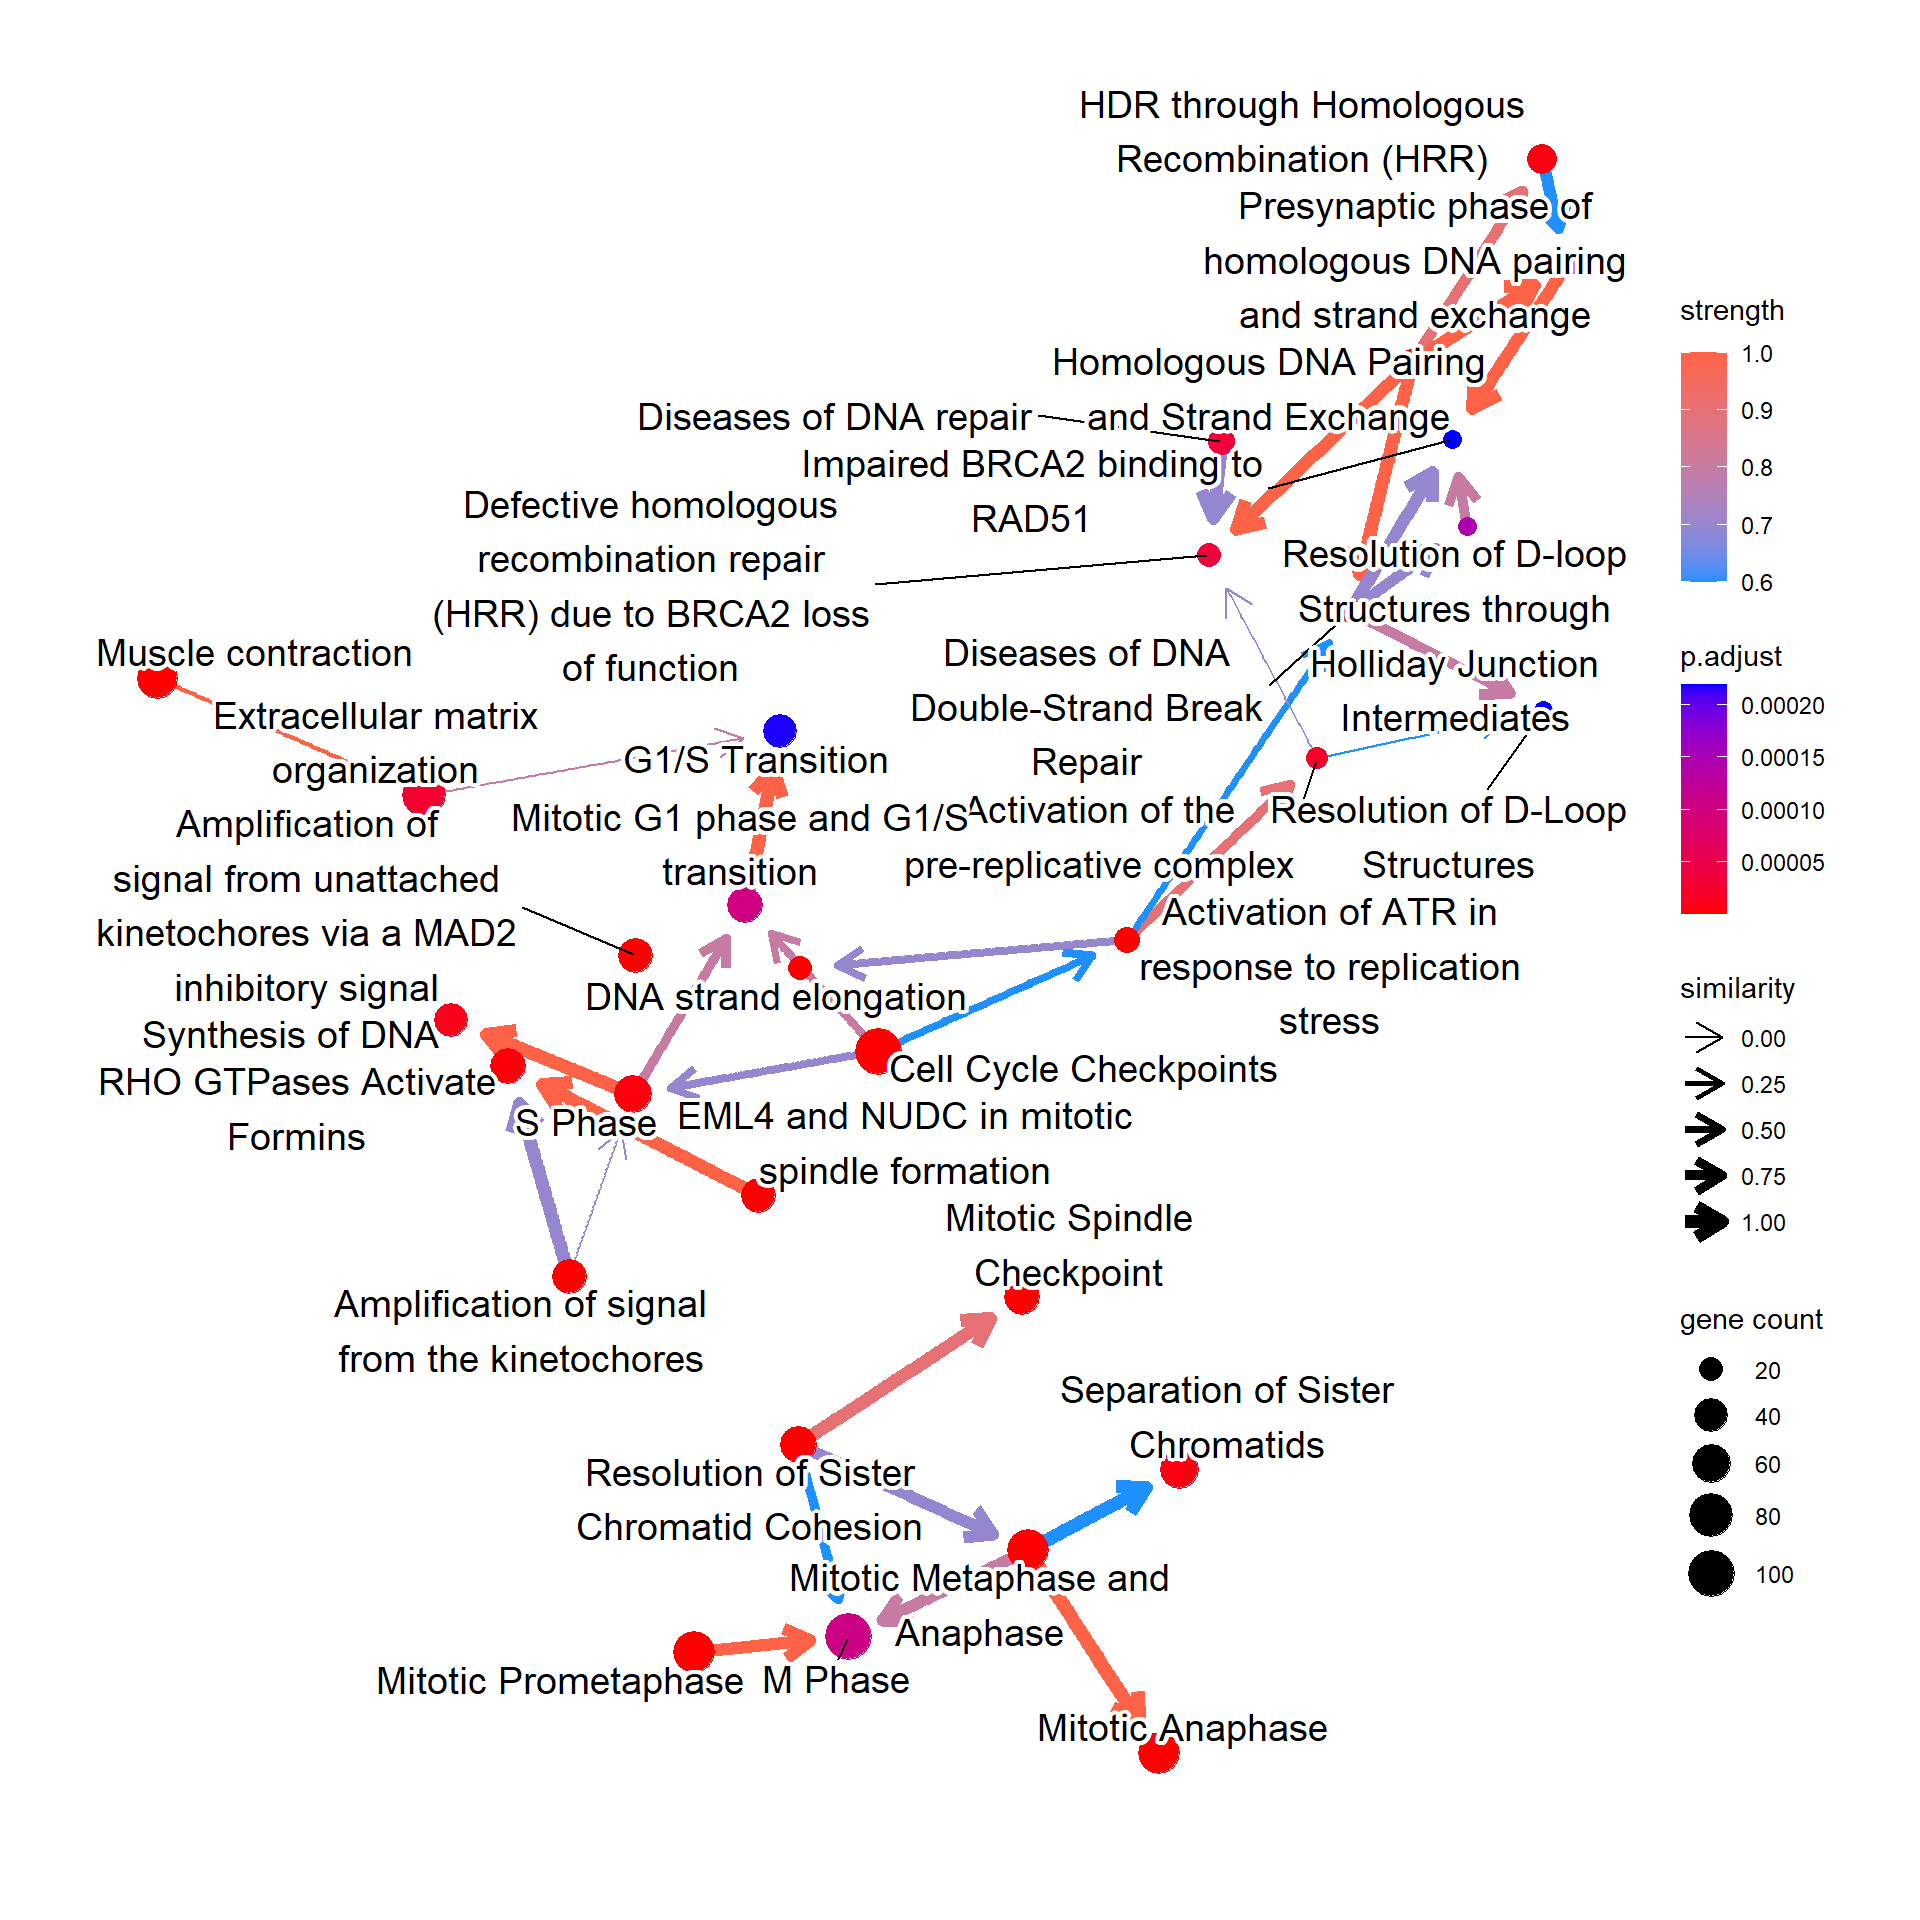
For the messy plot, the label can be modified using shadowText=TRUE.
bnpathplot(results = pway,
           exp = vsted,
           expSample = incSample,
           nCategory = 30,
           R = 10,
           labelSize=3,
           shadowText=TRUE,
           expRow = "ENSEMBL")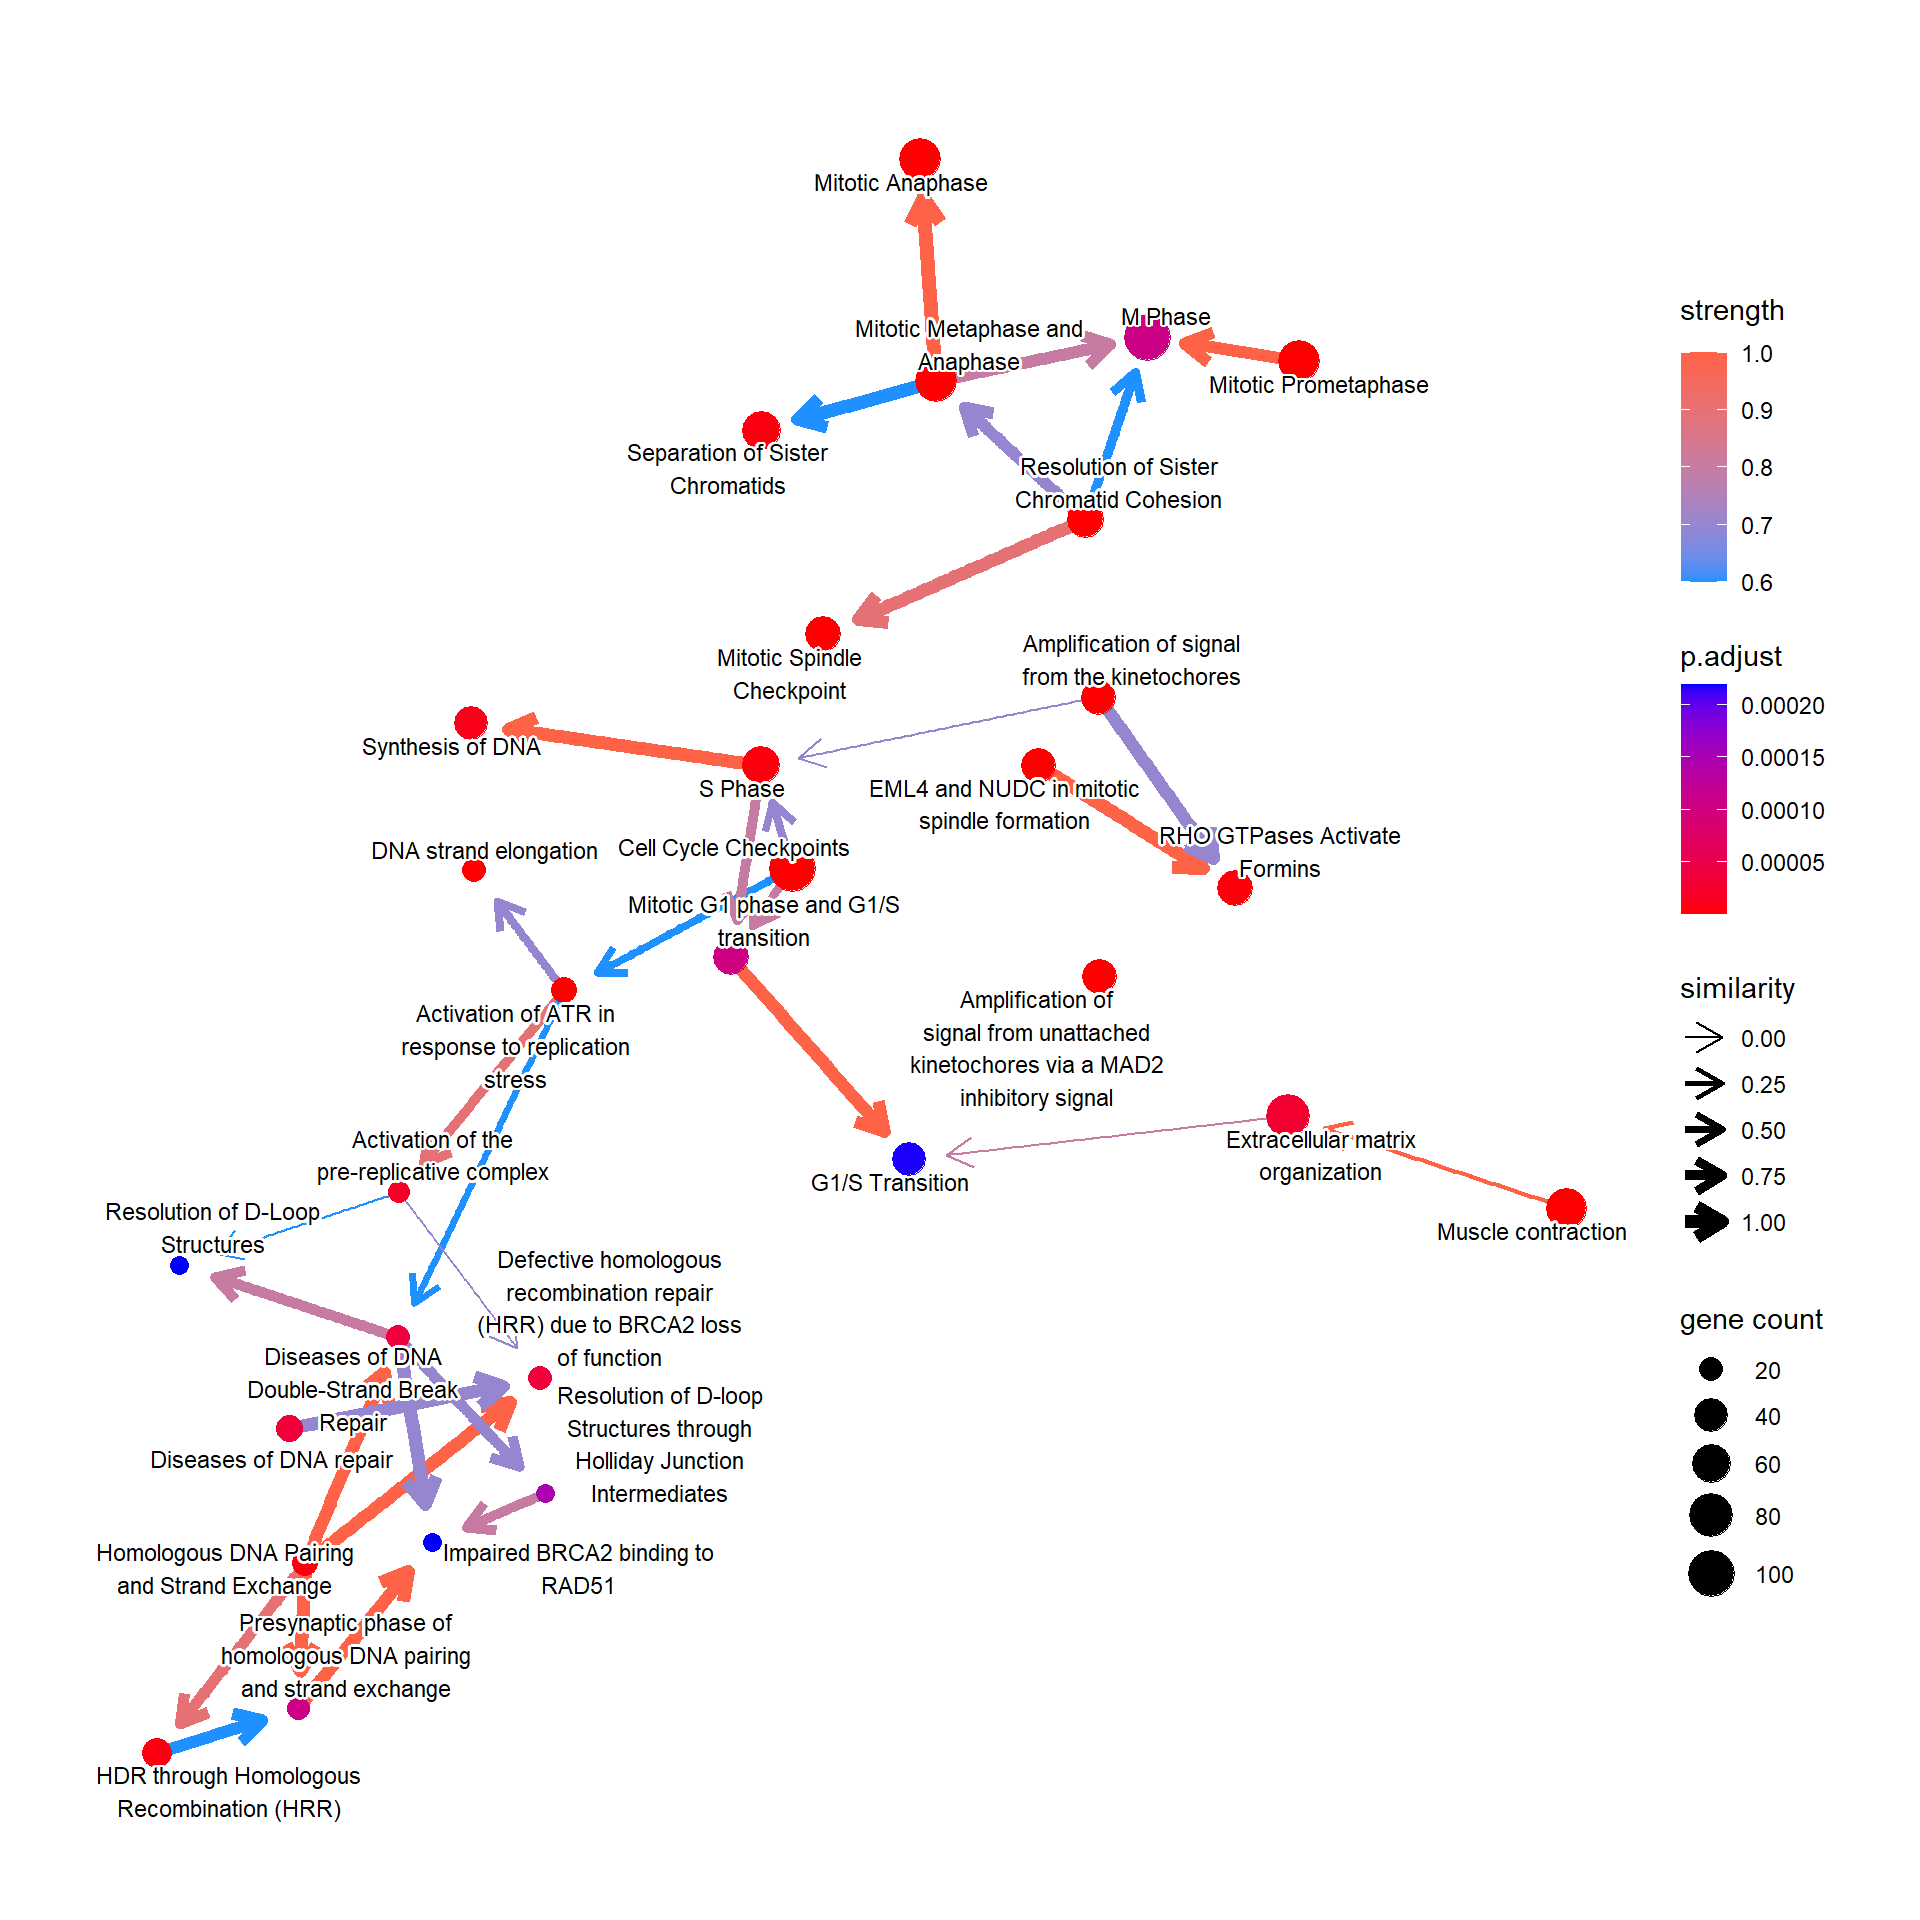
It can be KEGG or GO pathway results using enrichKEGG and enrichGO.
bnpathplot(results = pwayGO,
           exp = vsted,
           expSample = incSample,
           nCategory = 30,
           R = 10,
           expRow = "ENSEMBL")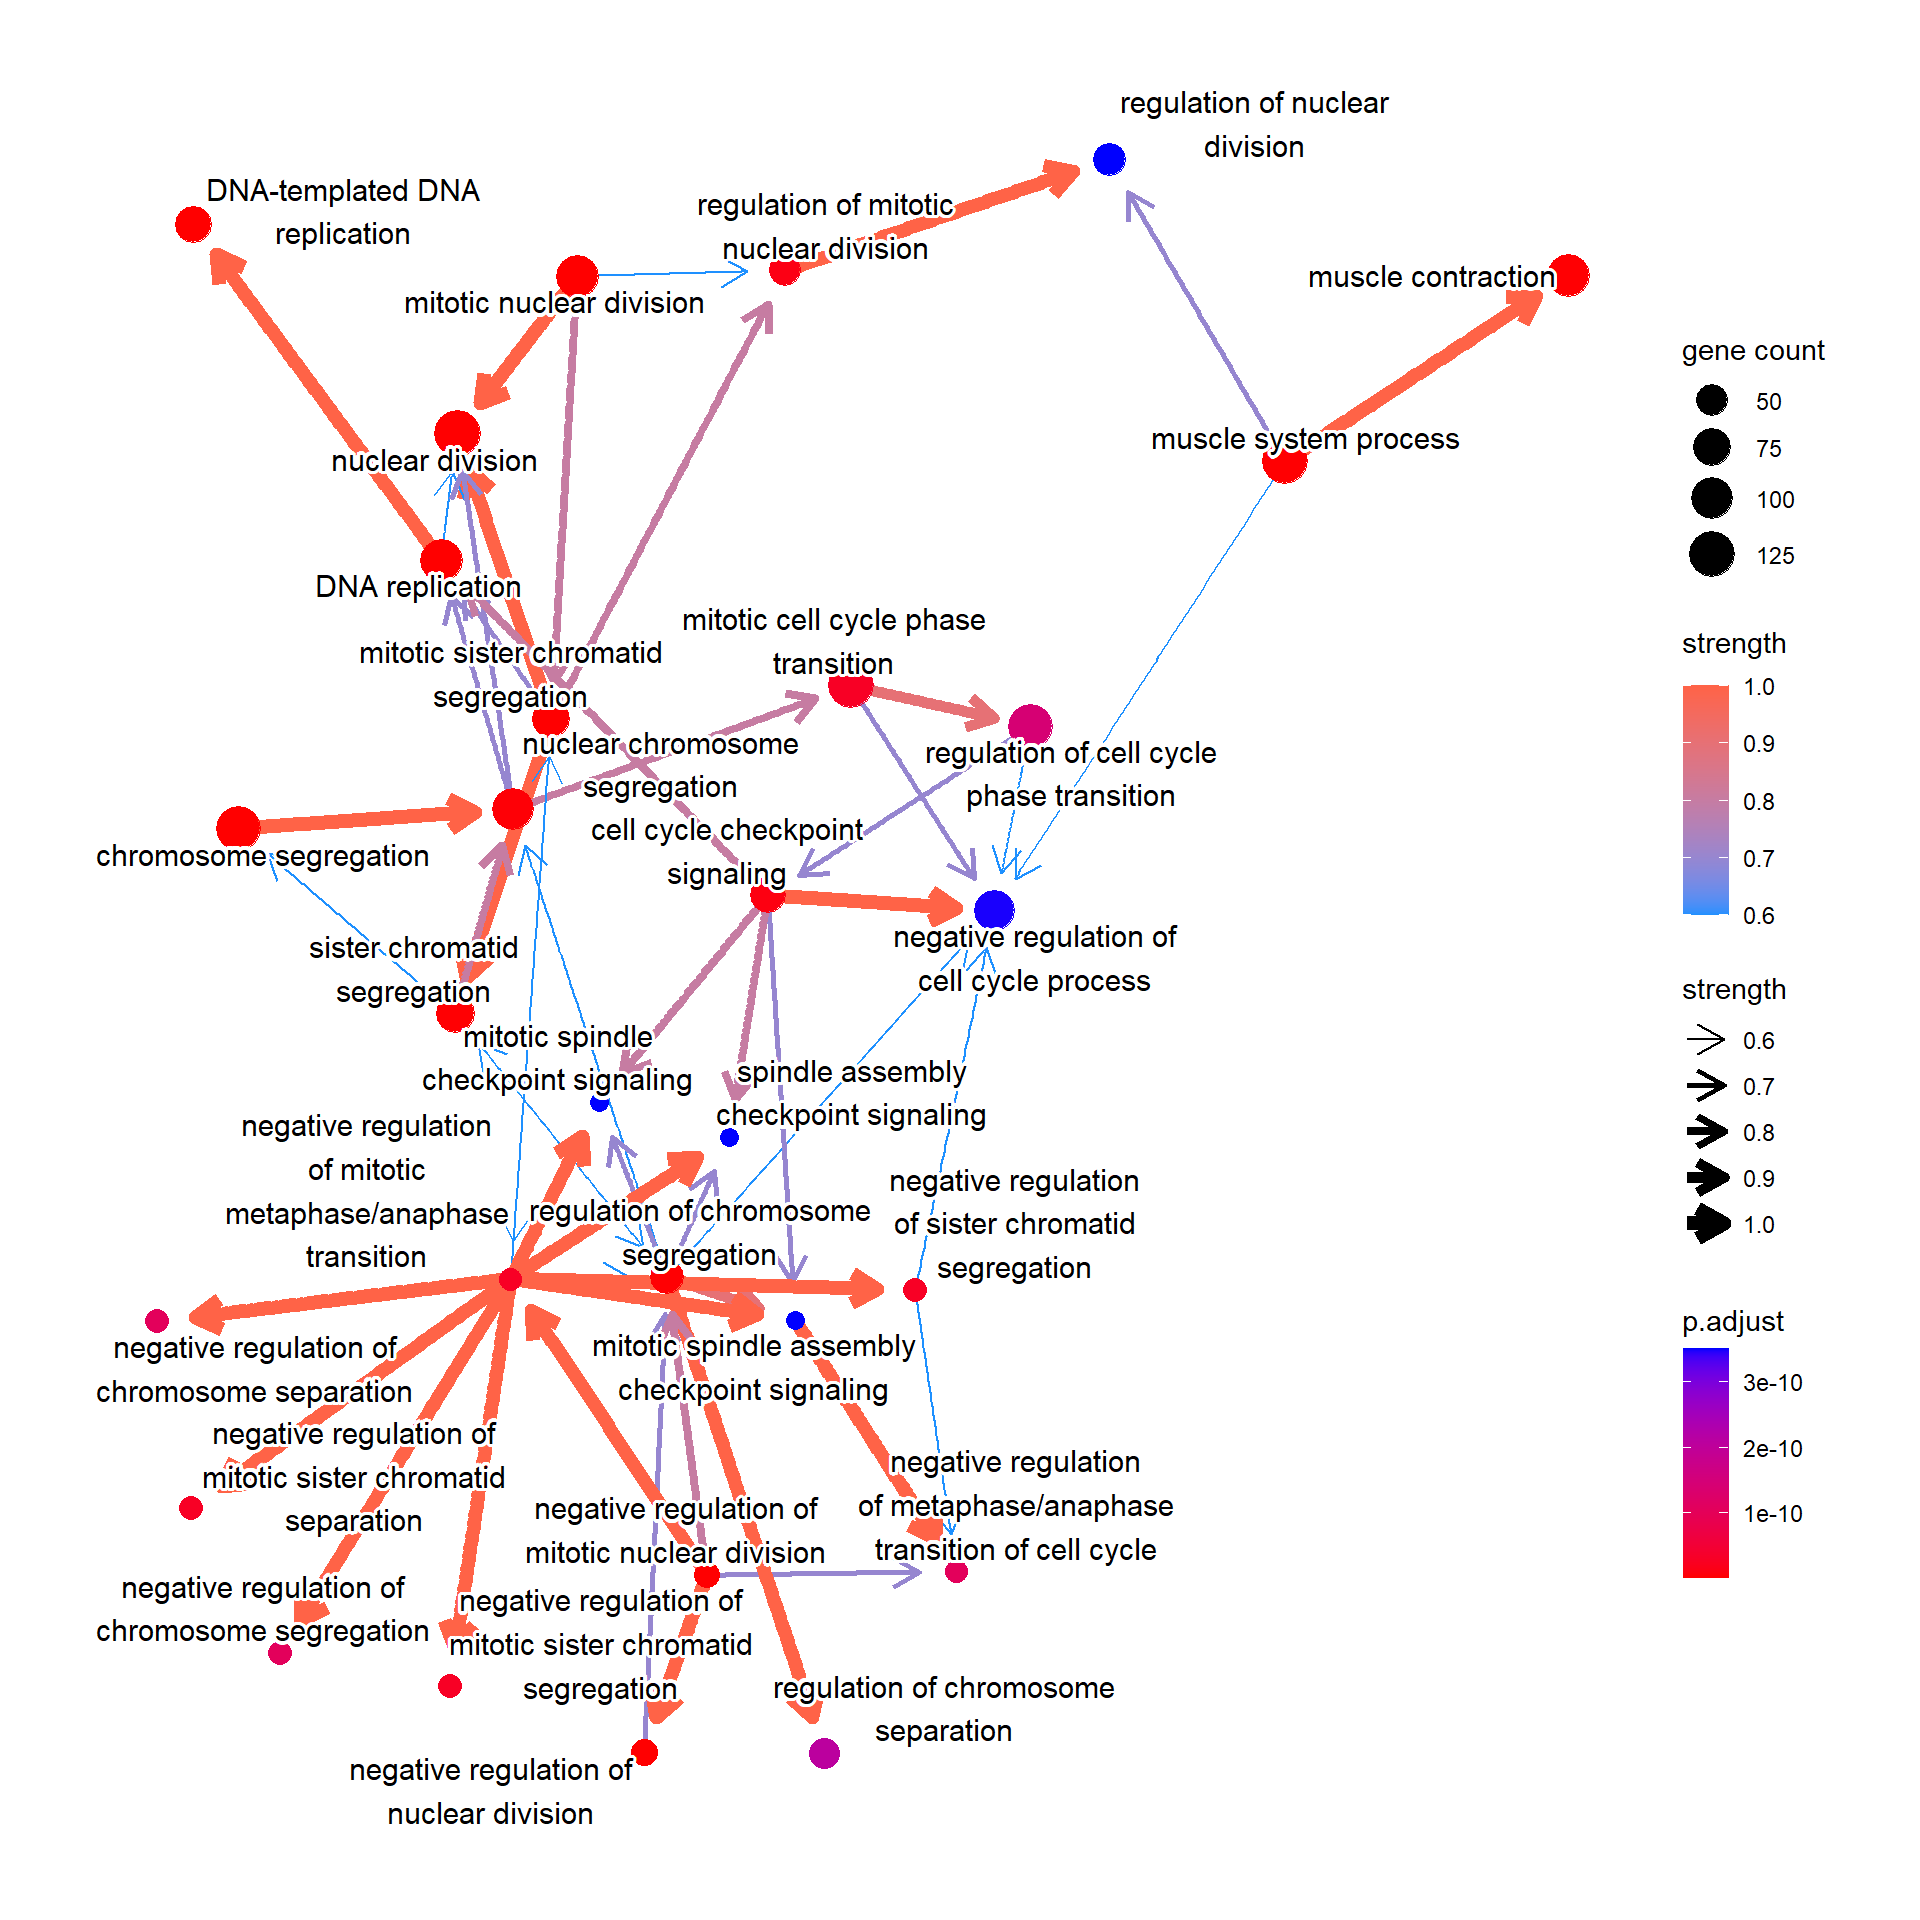
Or it can be the GSEA result.
bnpathplot(results = pwayGSE,
           exp = vsted,
           expSample = incSample,
           nCategory = 30,
           R = 10,
           expRow = "ENSEMBL",
           shadowText = TRUE,
           color = "enrichmentScore")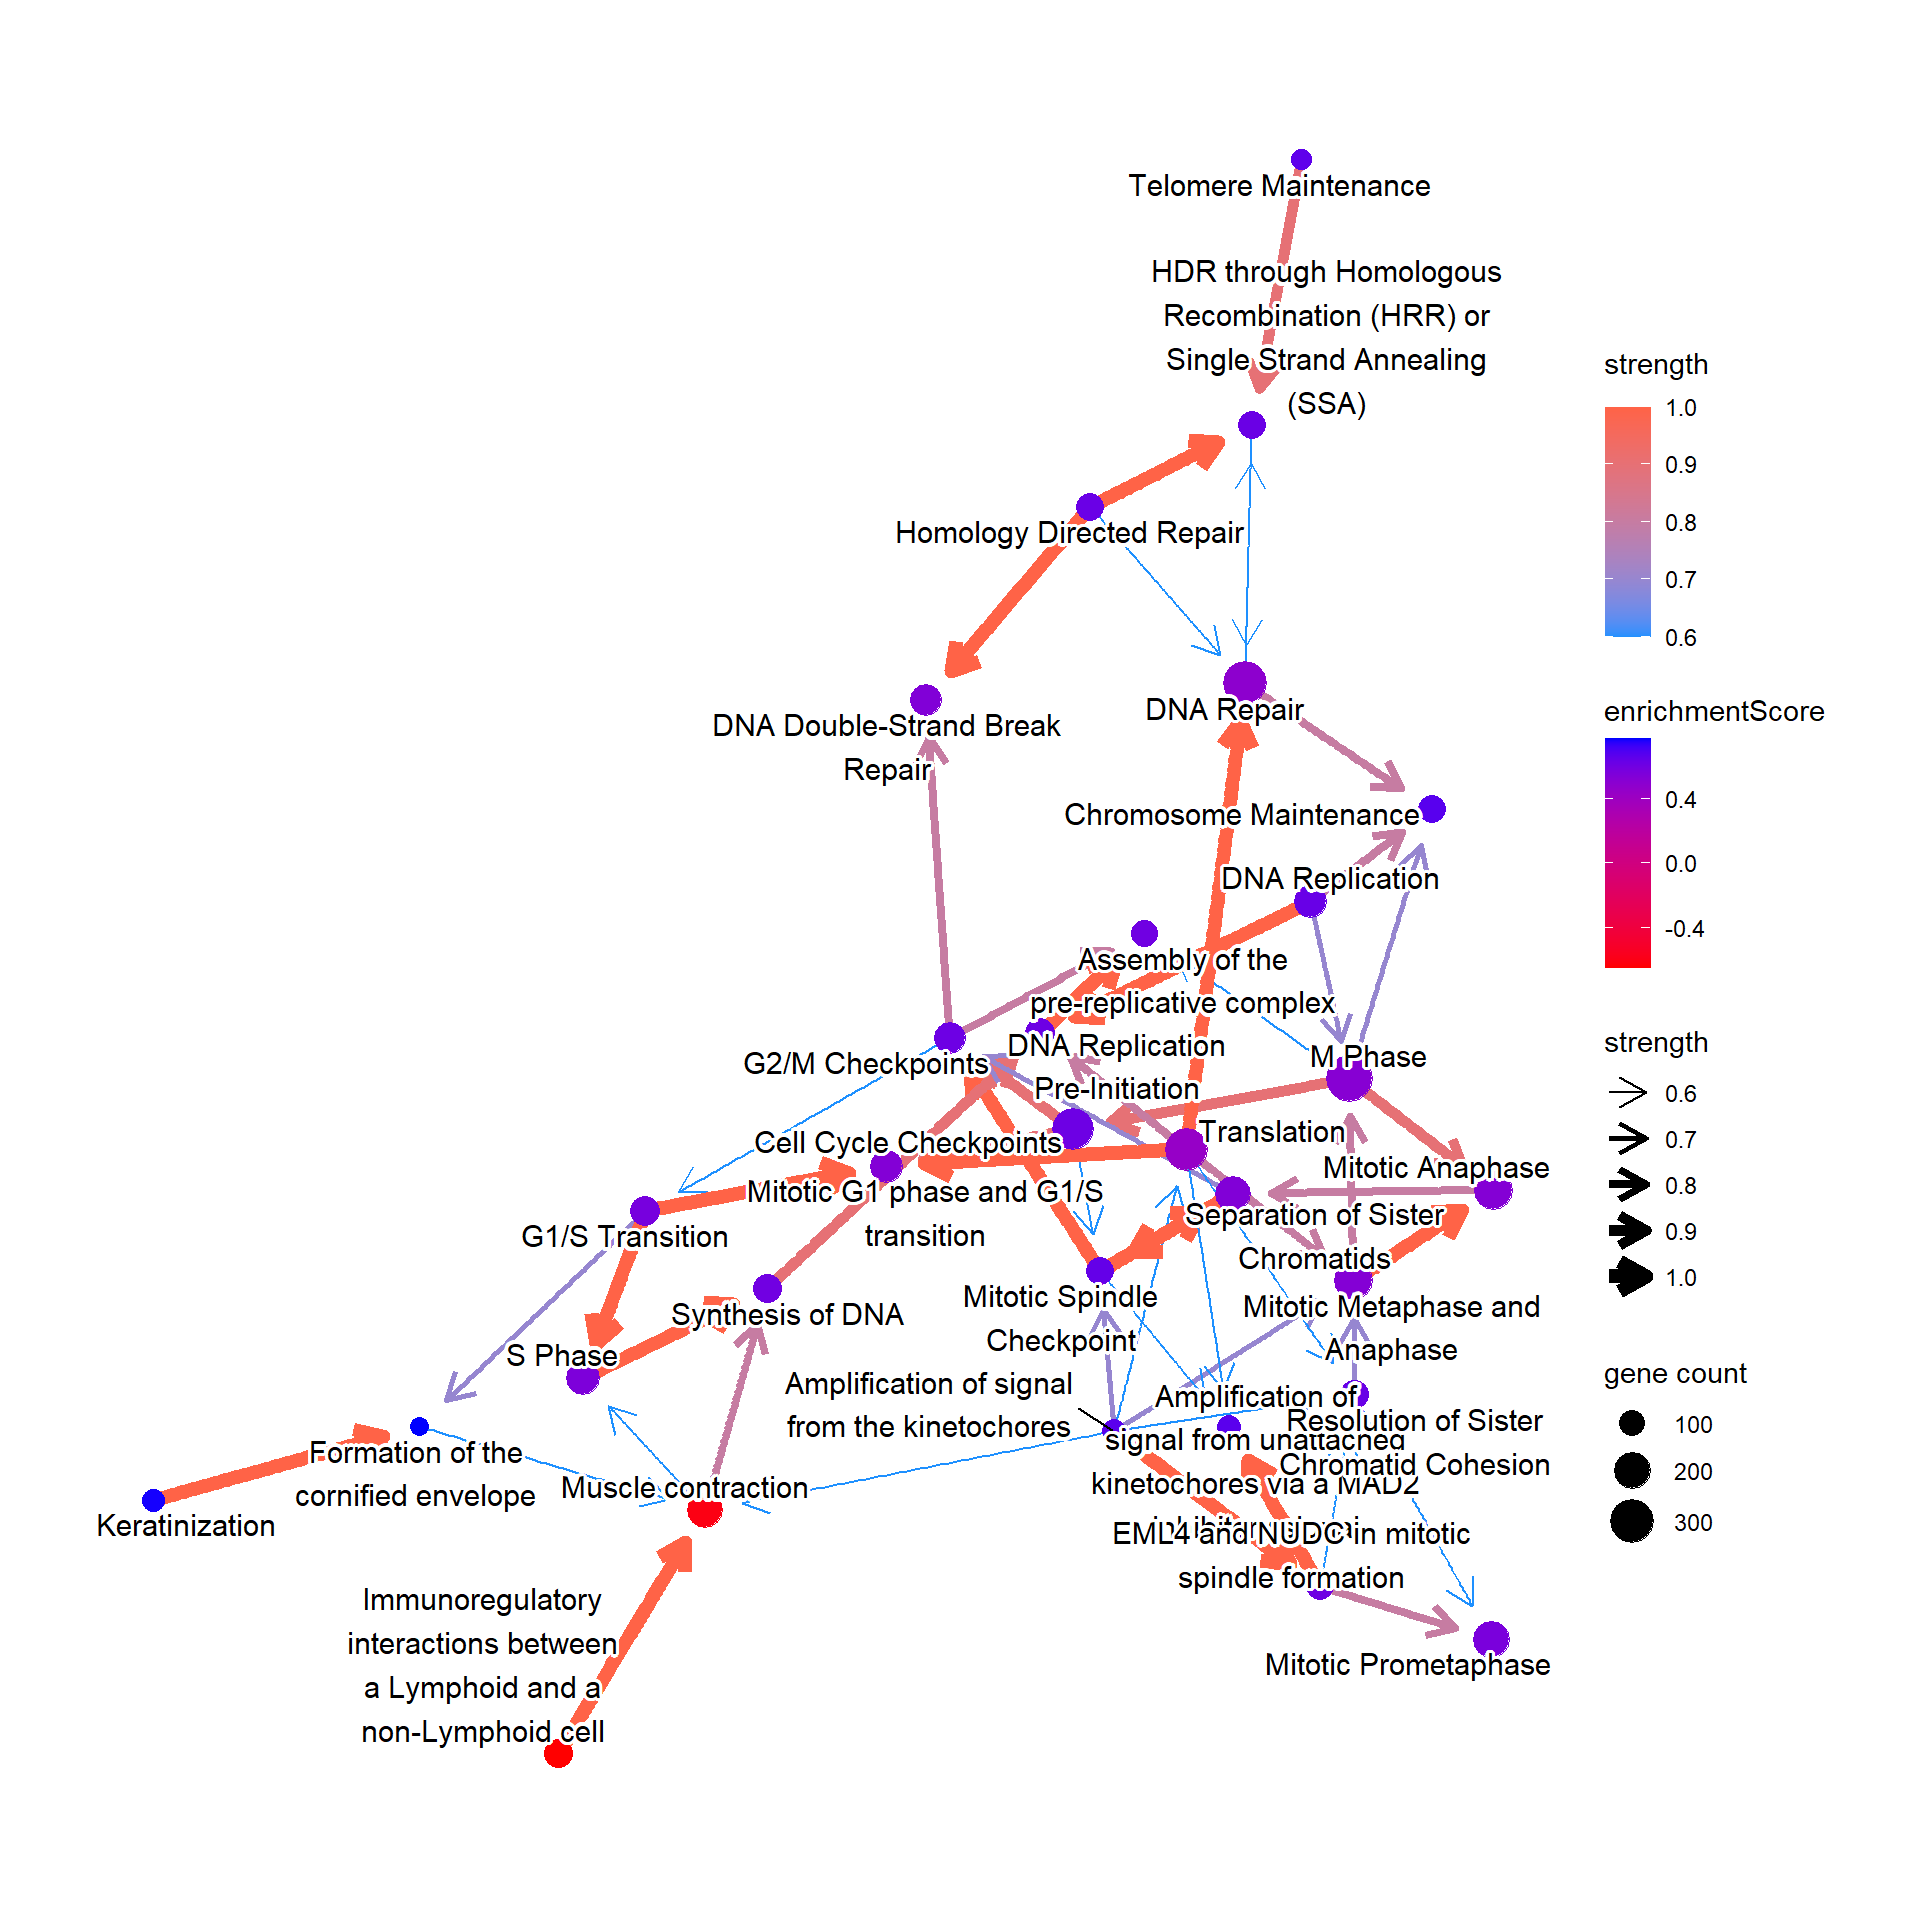
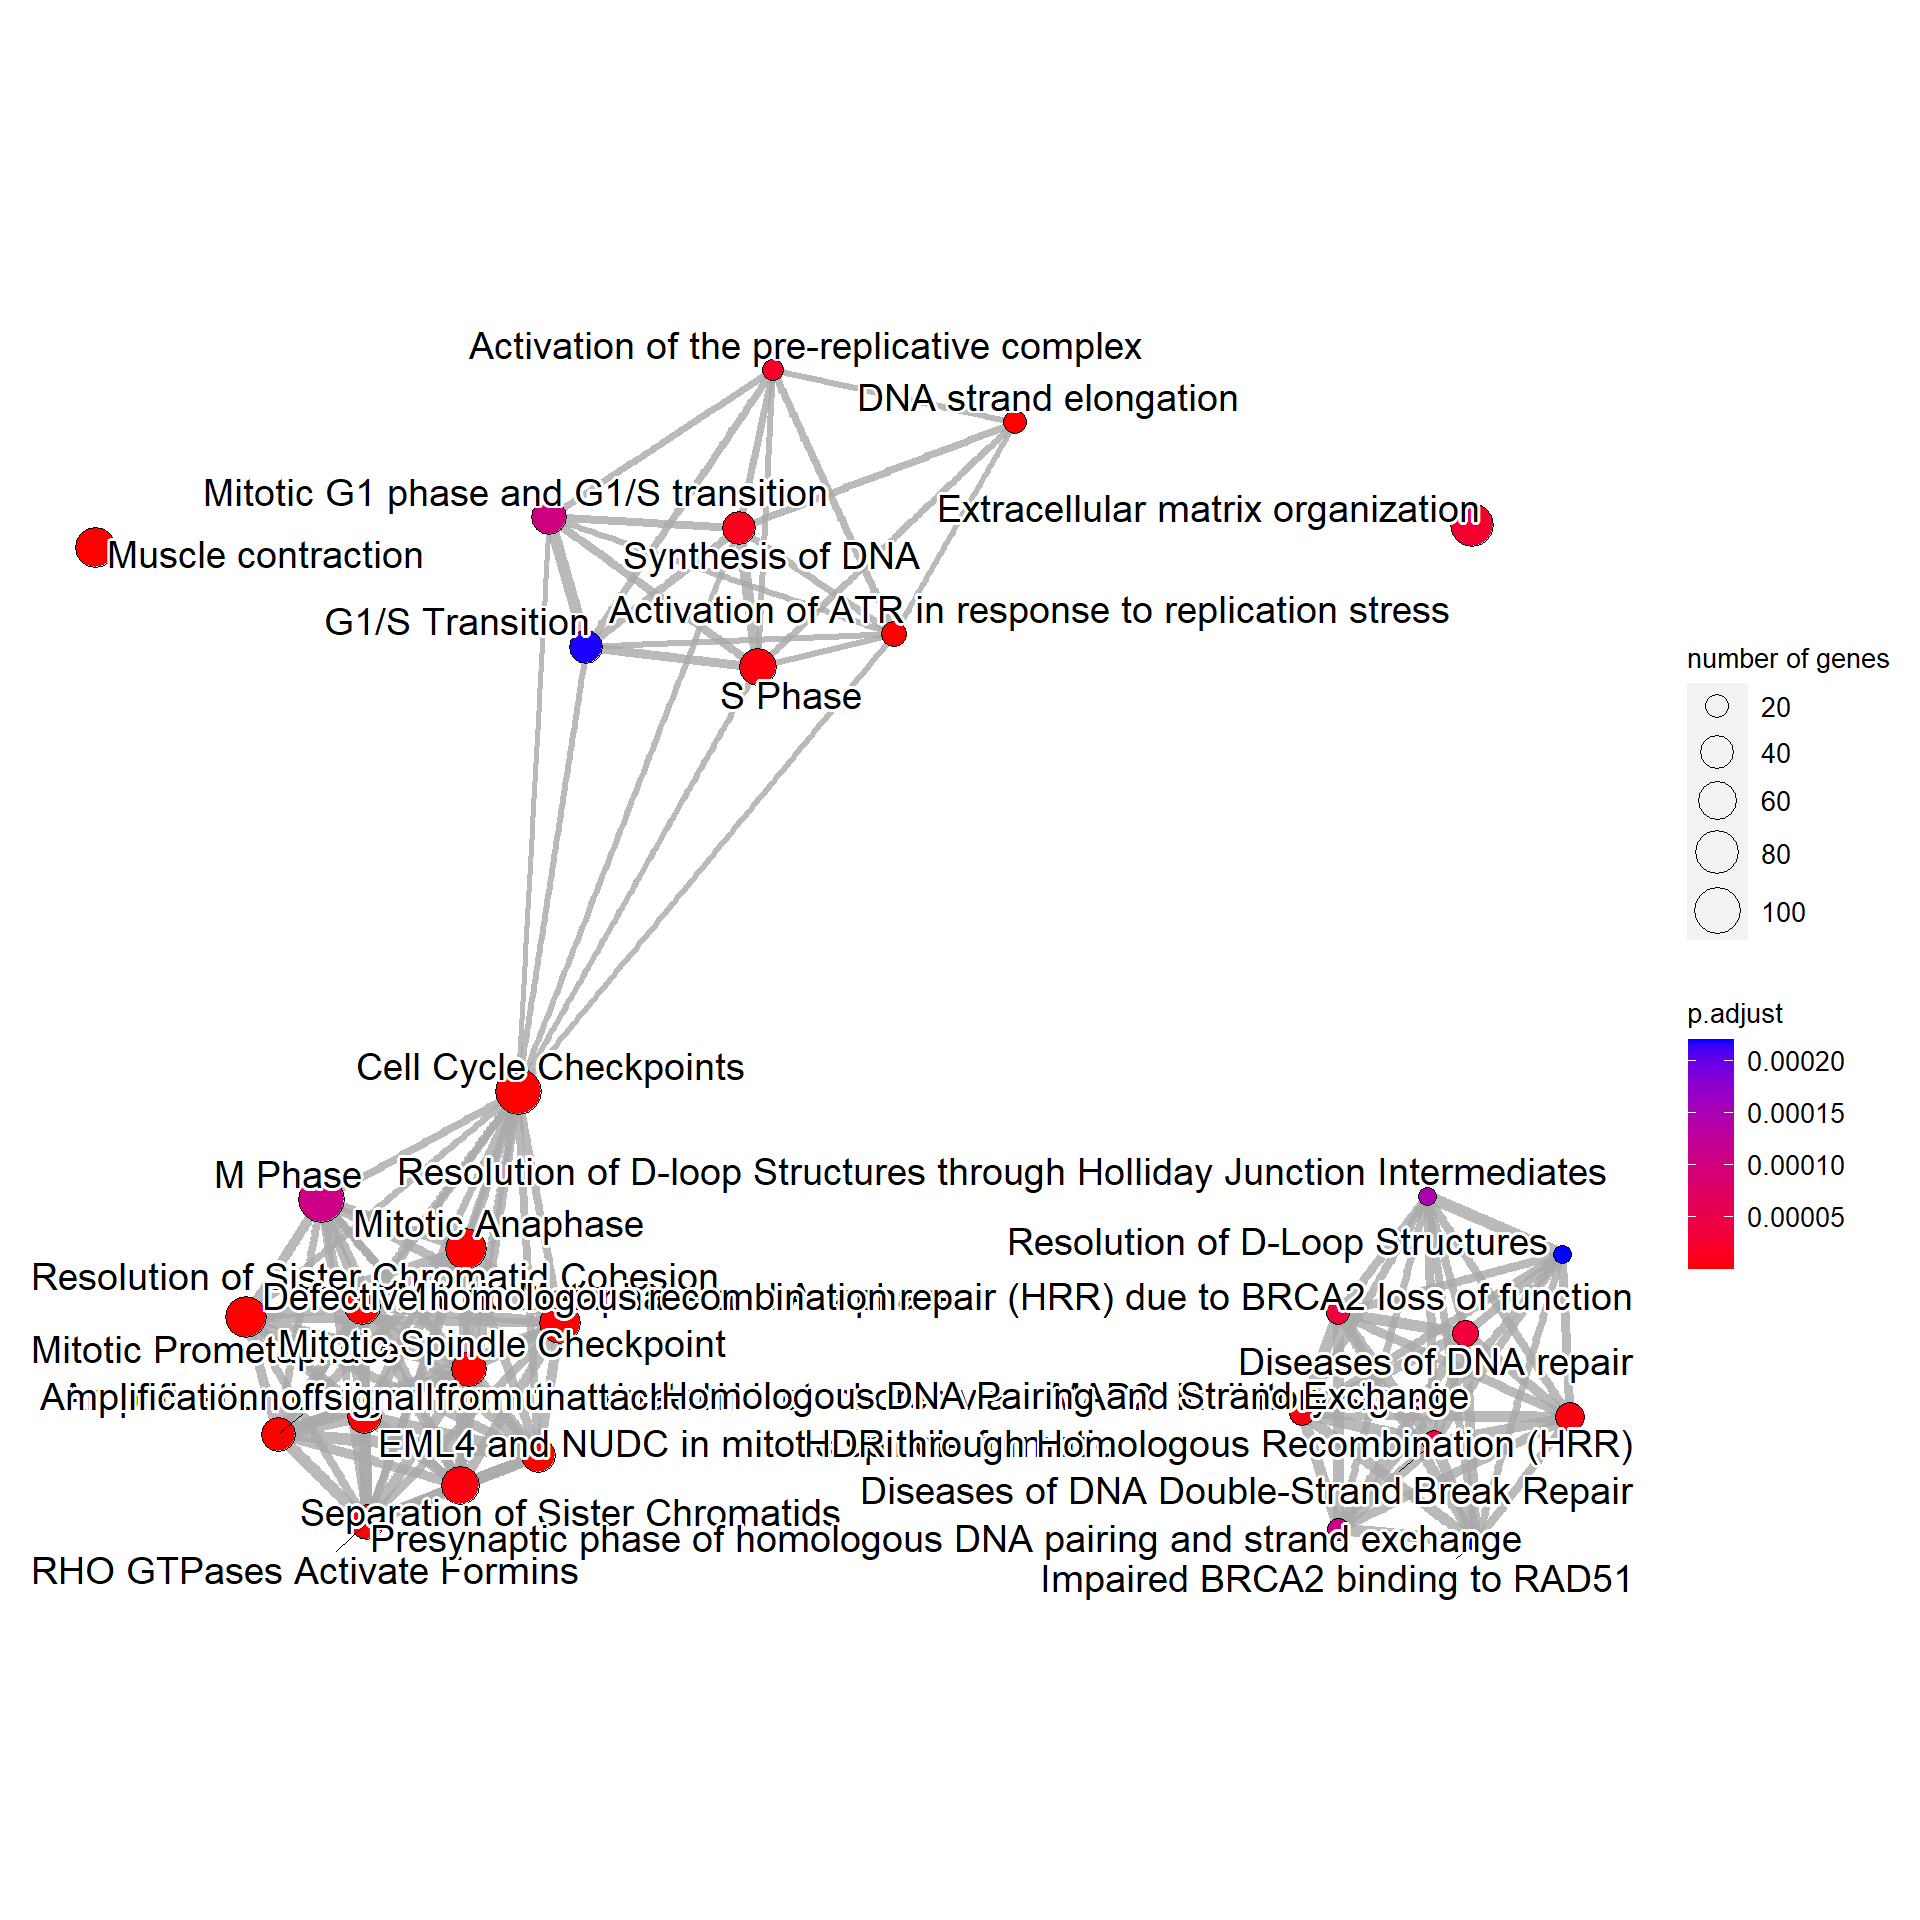
4.3 Compare with the reference
For Reactome, the relationship between pathways can also be plotted by specifying compareRef=TRUE. Here, dotted lines indicate relationship not in the reference, and solid lines indicate those in the reference.
bnpathplot(results = pway,
           exp = vsted,
           expSample = incSample,
           nCategory = 30,
           R = 10,
           compareRef=T,
           expRow = "ENSEMBL")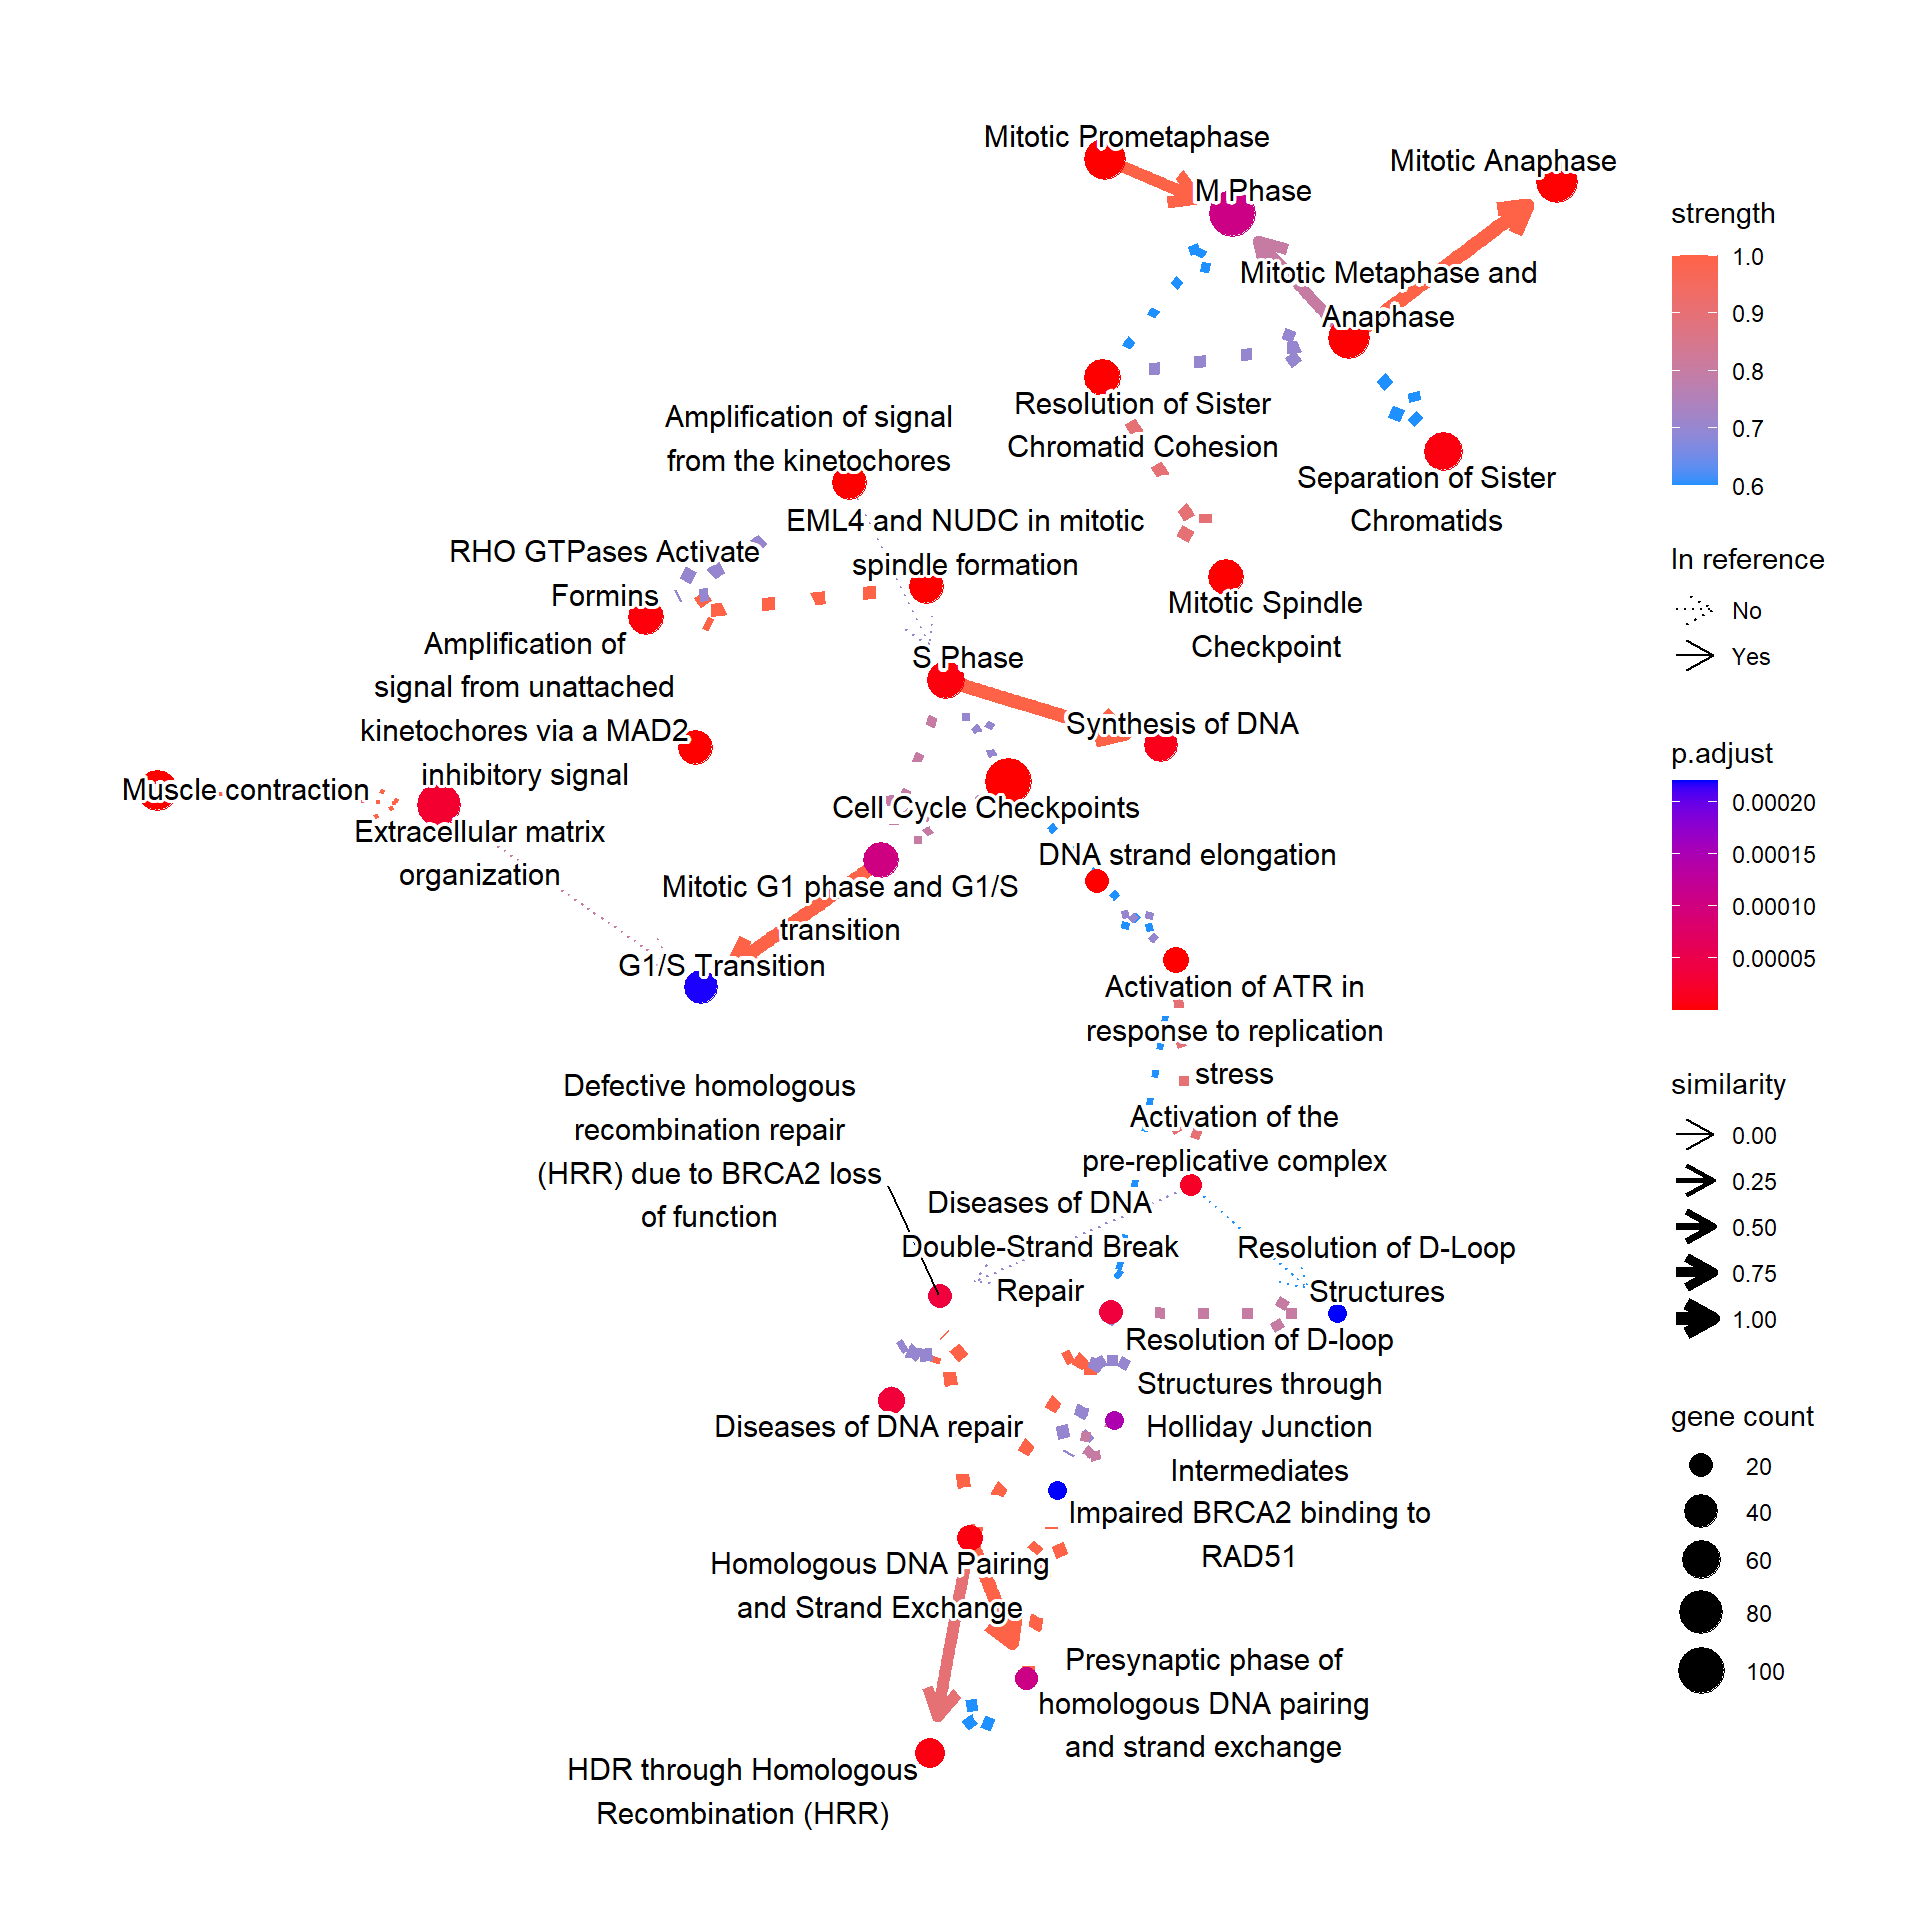
4.4 Reflect DepMap information to pathways
We can reflect overall dependency scores for the genes within the pathway by specifying sizeDep=TRUE. You must provide depmap::depmap_crispr or the other data describing the dependency score to dep variable. The average score of the genes in the pathway is used.
bnpathplot(results = pwayGO,
           exp = vsted,
           expSample = incSample,
           nCategory = 30,
           R = 50,
           sizeDep = T,
           dep = dep,
           expRow = "ENSEMBL")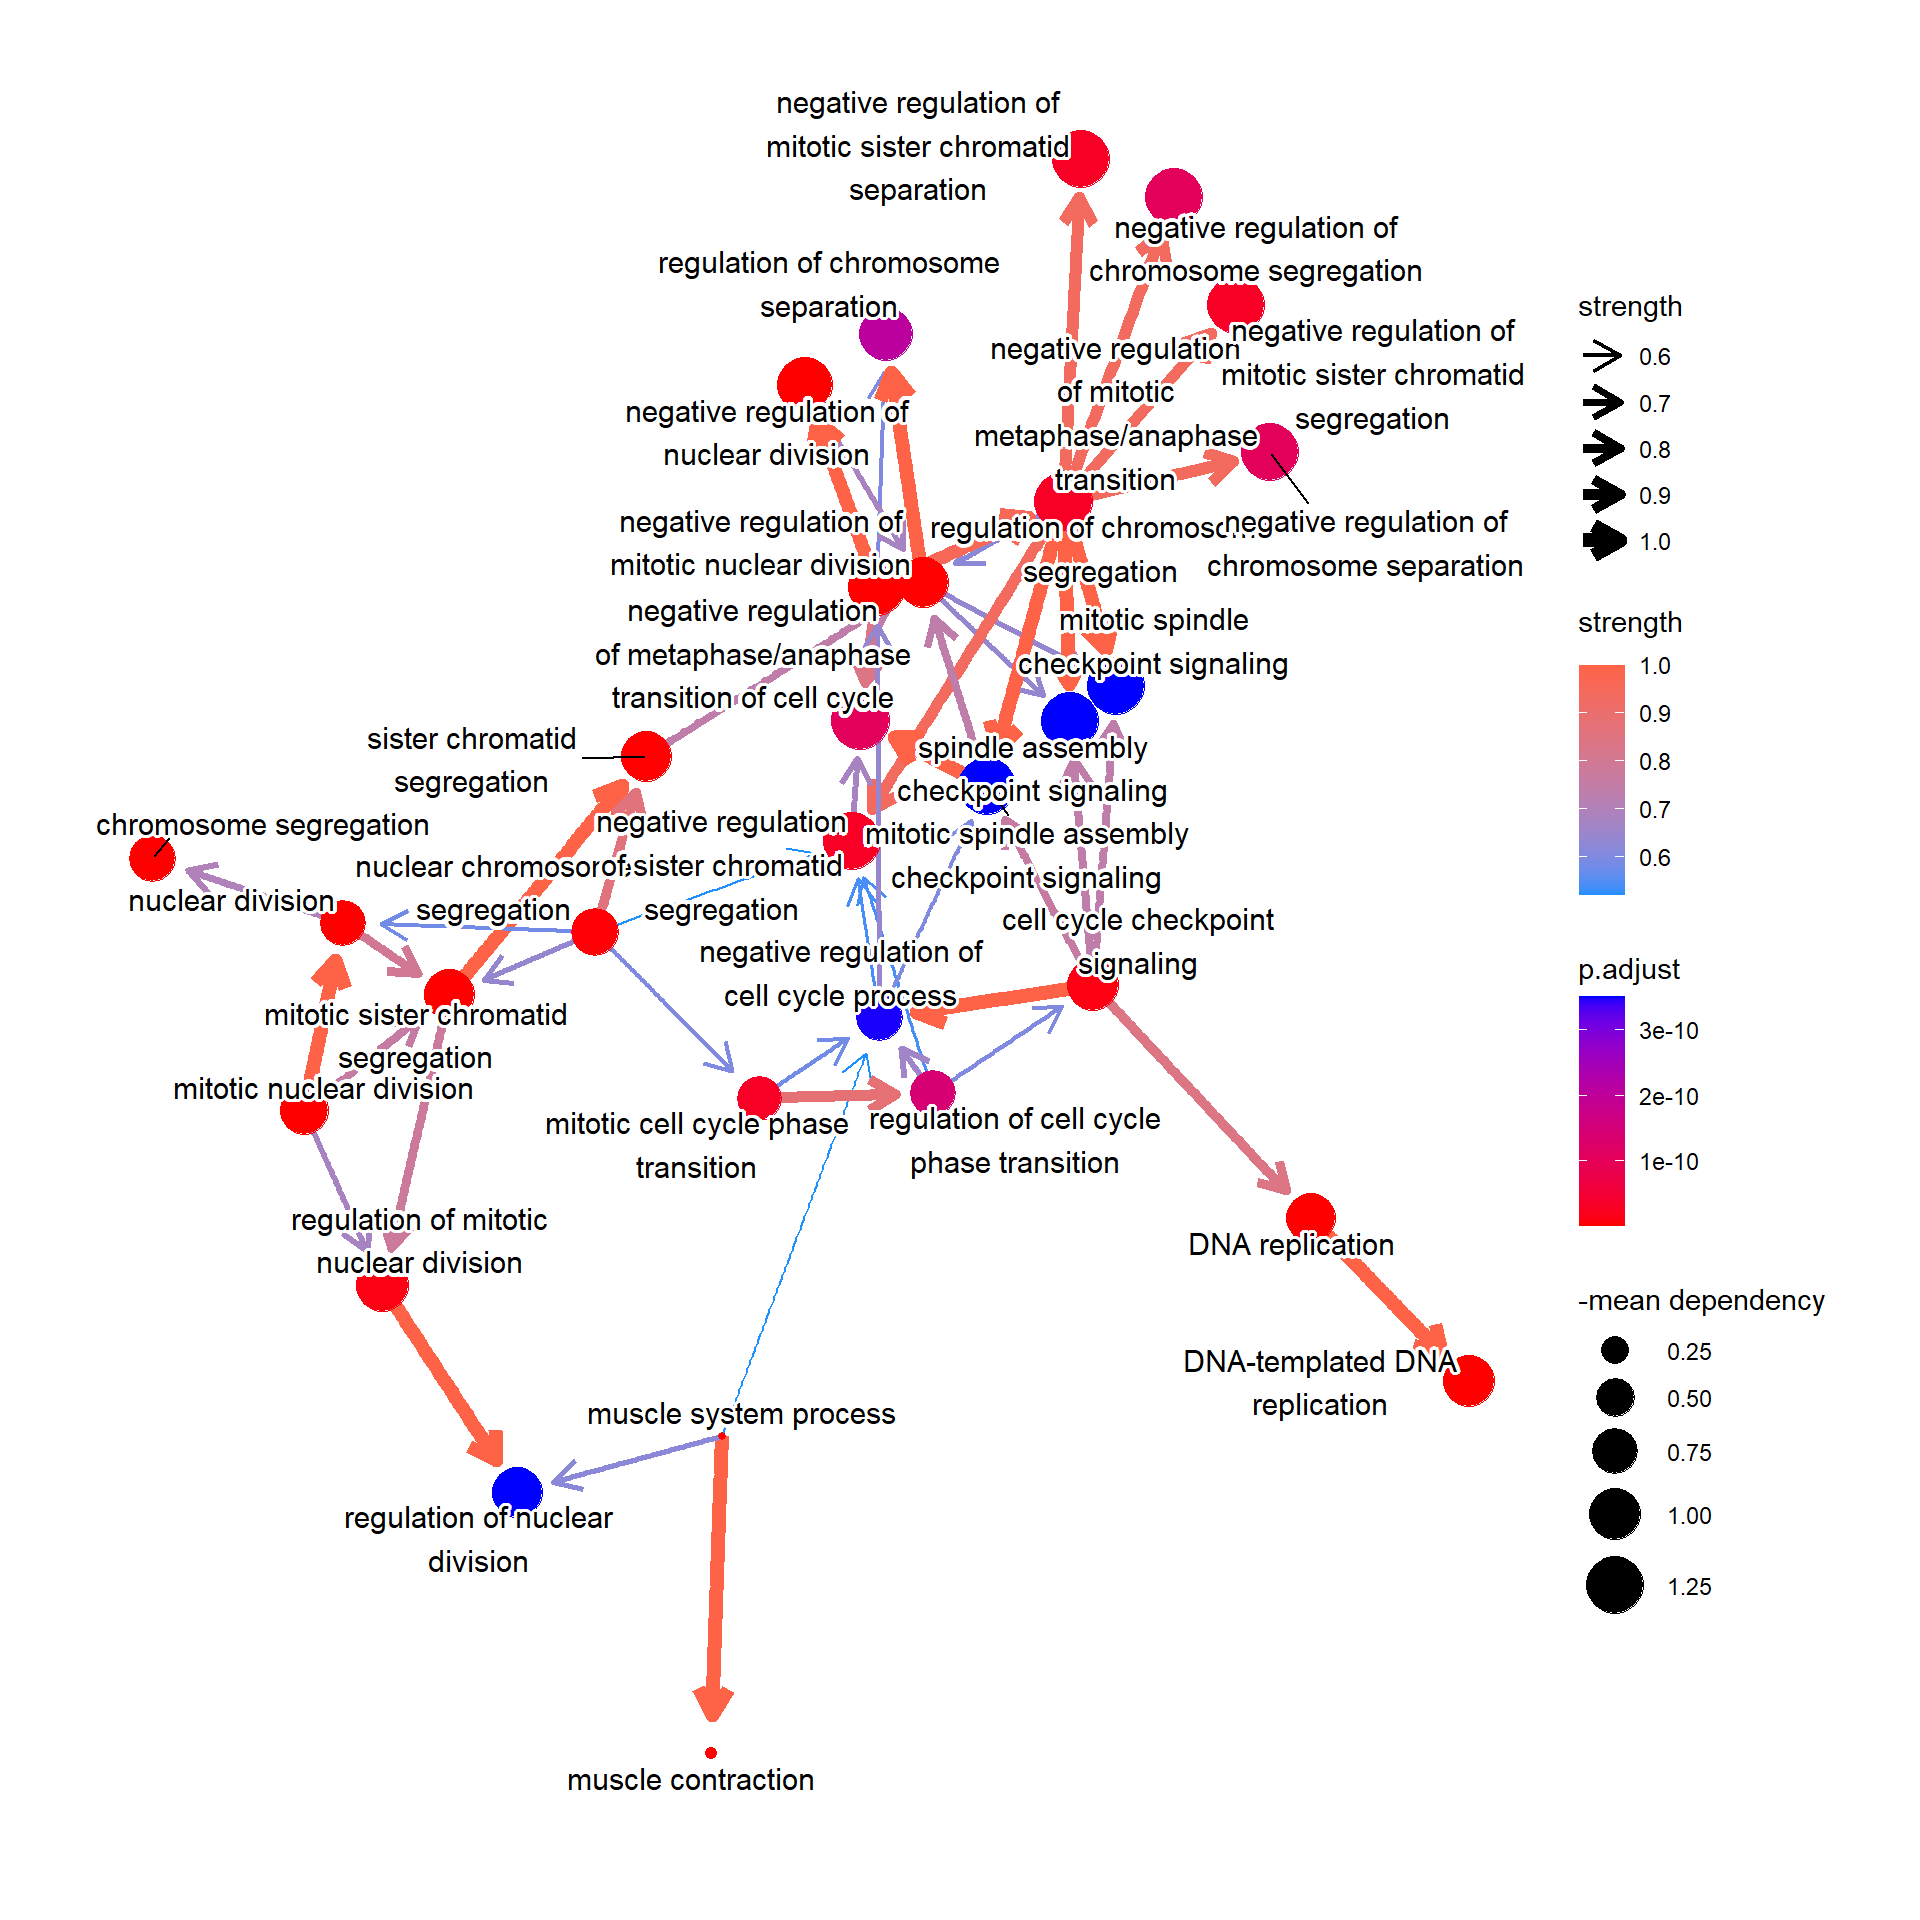
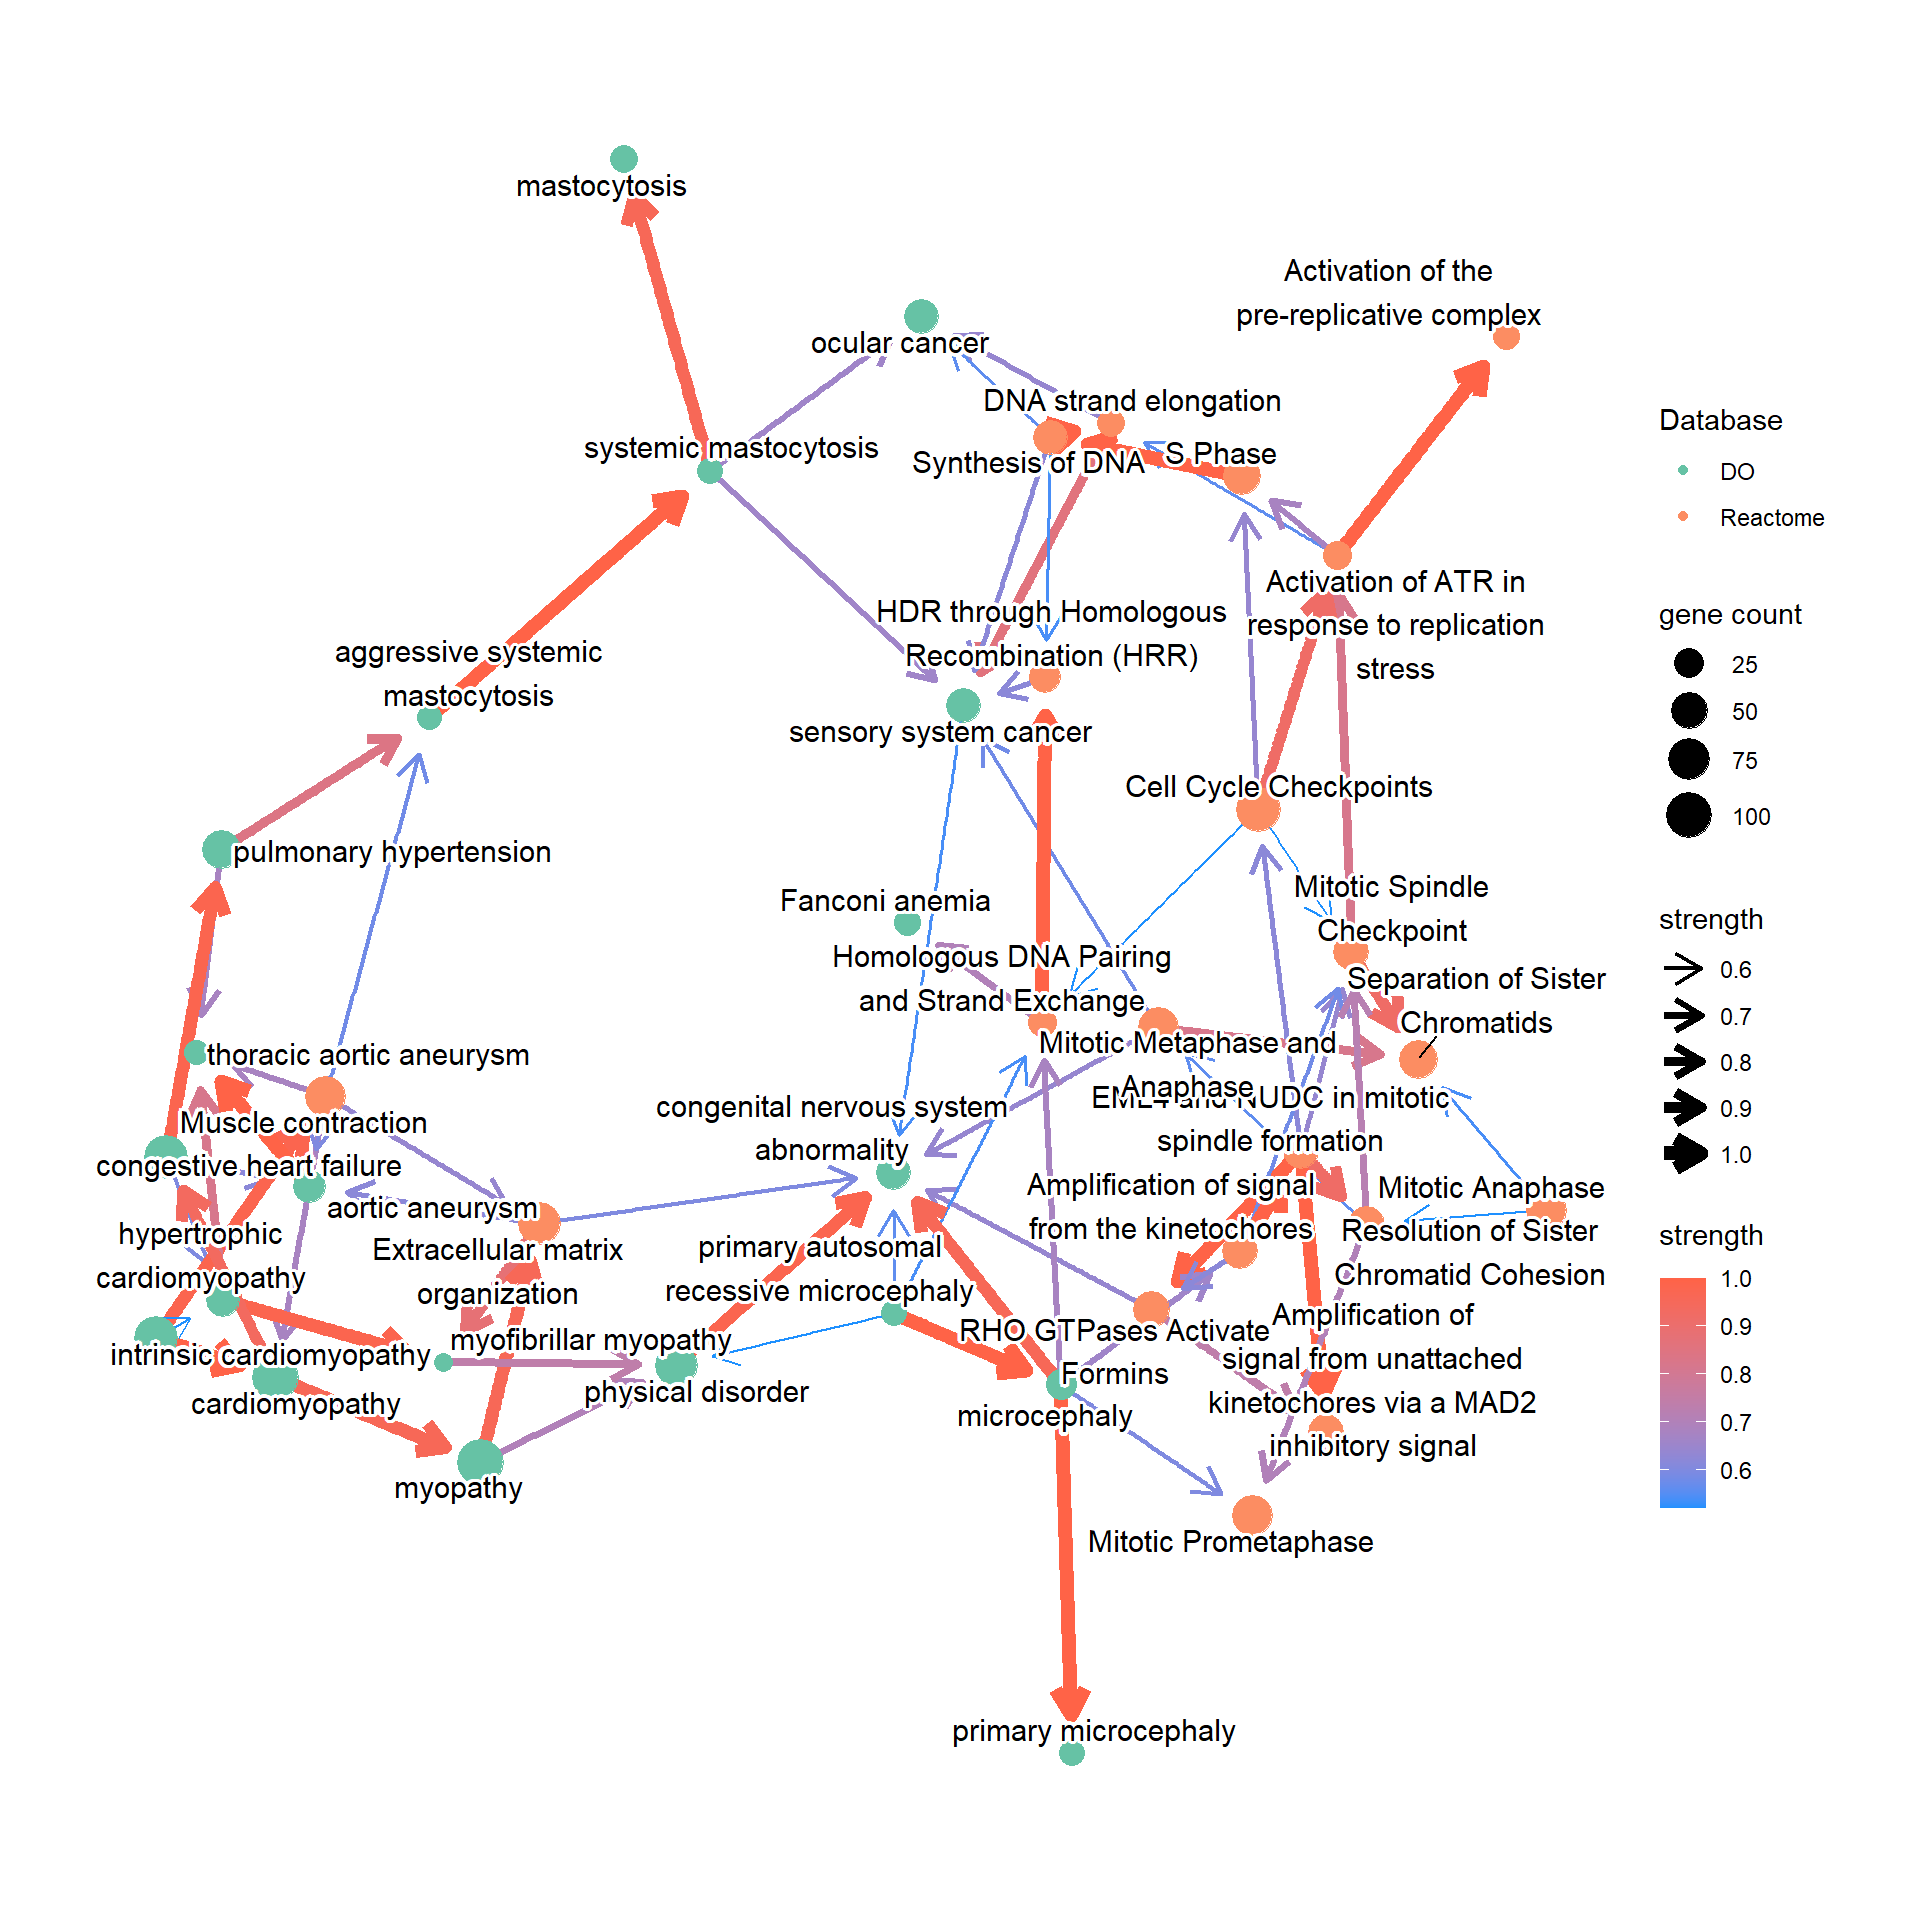
4.5 Aggregating the pathway databases
The multiple GSEA results can be aggregated, by just passing the multiple results like as follows. When choosing the number of categories (nCategory), the order of the results and the numbers should be same.
library(DOSE)
pwayDO <- enrichDO(gene = cand.entrez)
ReaAndDO <- bnpathplot(results = c(pway, pwayDO), exp = vsted, expSample = incSample,
           nCategory = c(20, 20), R = 50)
ReaAndDO