graphhighlight
Noriaki Sato
2023-03-27
usage_of_graphhighlight.Rmdgraphhighlight
This package highlights nodes, edges and node texts of ggraph plots when one wants to inspect the graph information after the plots are created.
Usage
Generate a random graph.
library(ggraph)
library(igraph)
library(graphhighlight)

set.seed(1)
g <- random.graph.game(10,0.1,directed=TRUE)
E(g)$weight <- sample(1:10, length(E(g)), replace=TRUE)
V(g)$size <- sample(1:10, length(V(g)), replace=TRUE)
V(g)$name <- letters[1:length(V(g))]
highlight_node
This function highlights the nodes by specifying
node_name or filter specifying conditions for
including nodes in string. If highlight_color is specified,
the node color will be changed.
ggraph(g, layout="nicely")+
  geom_node_point(aes(size=size))+
  highlight_node(filter=size>7,
                 highlight_color="red")+
  theme_graph()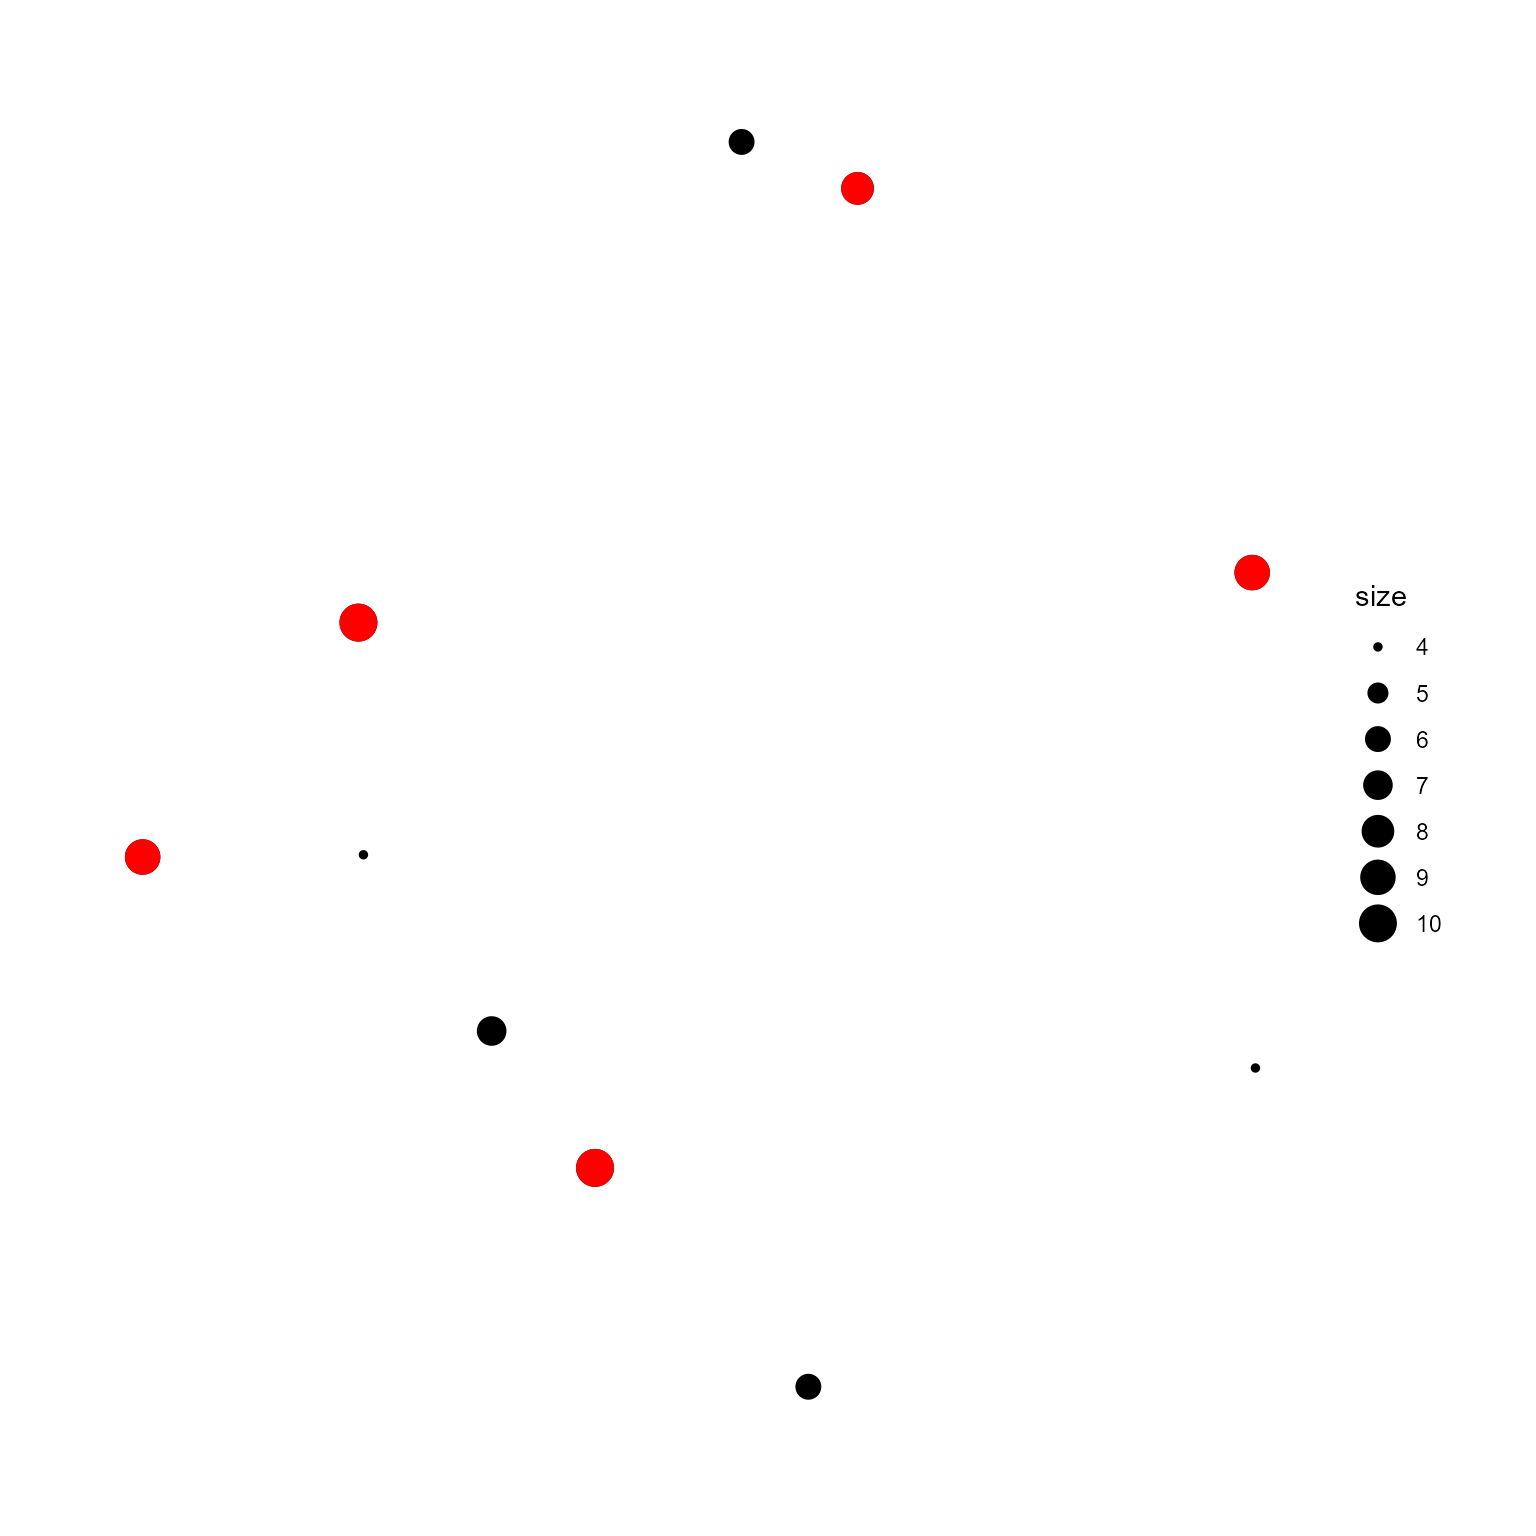
Or highlighting by some shapes by stacking the layers. If
specify_shape is specified, the nodes can be highlighted by
shape, and specify_shape_size determines the size,
shape_color the color of the shape.
ggraph(g, layout="nicely")+
  geom_node_point(aes(size=size))+
  highlight_node(filter=size>7,
                 shape_number = 21,
                 shape_size = 21,
                 shape_color="red")+
  theme_graph()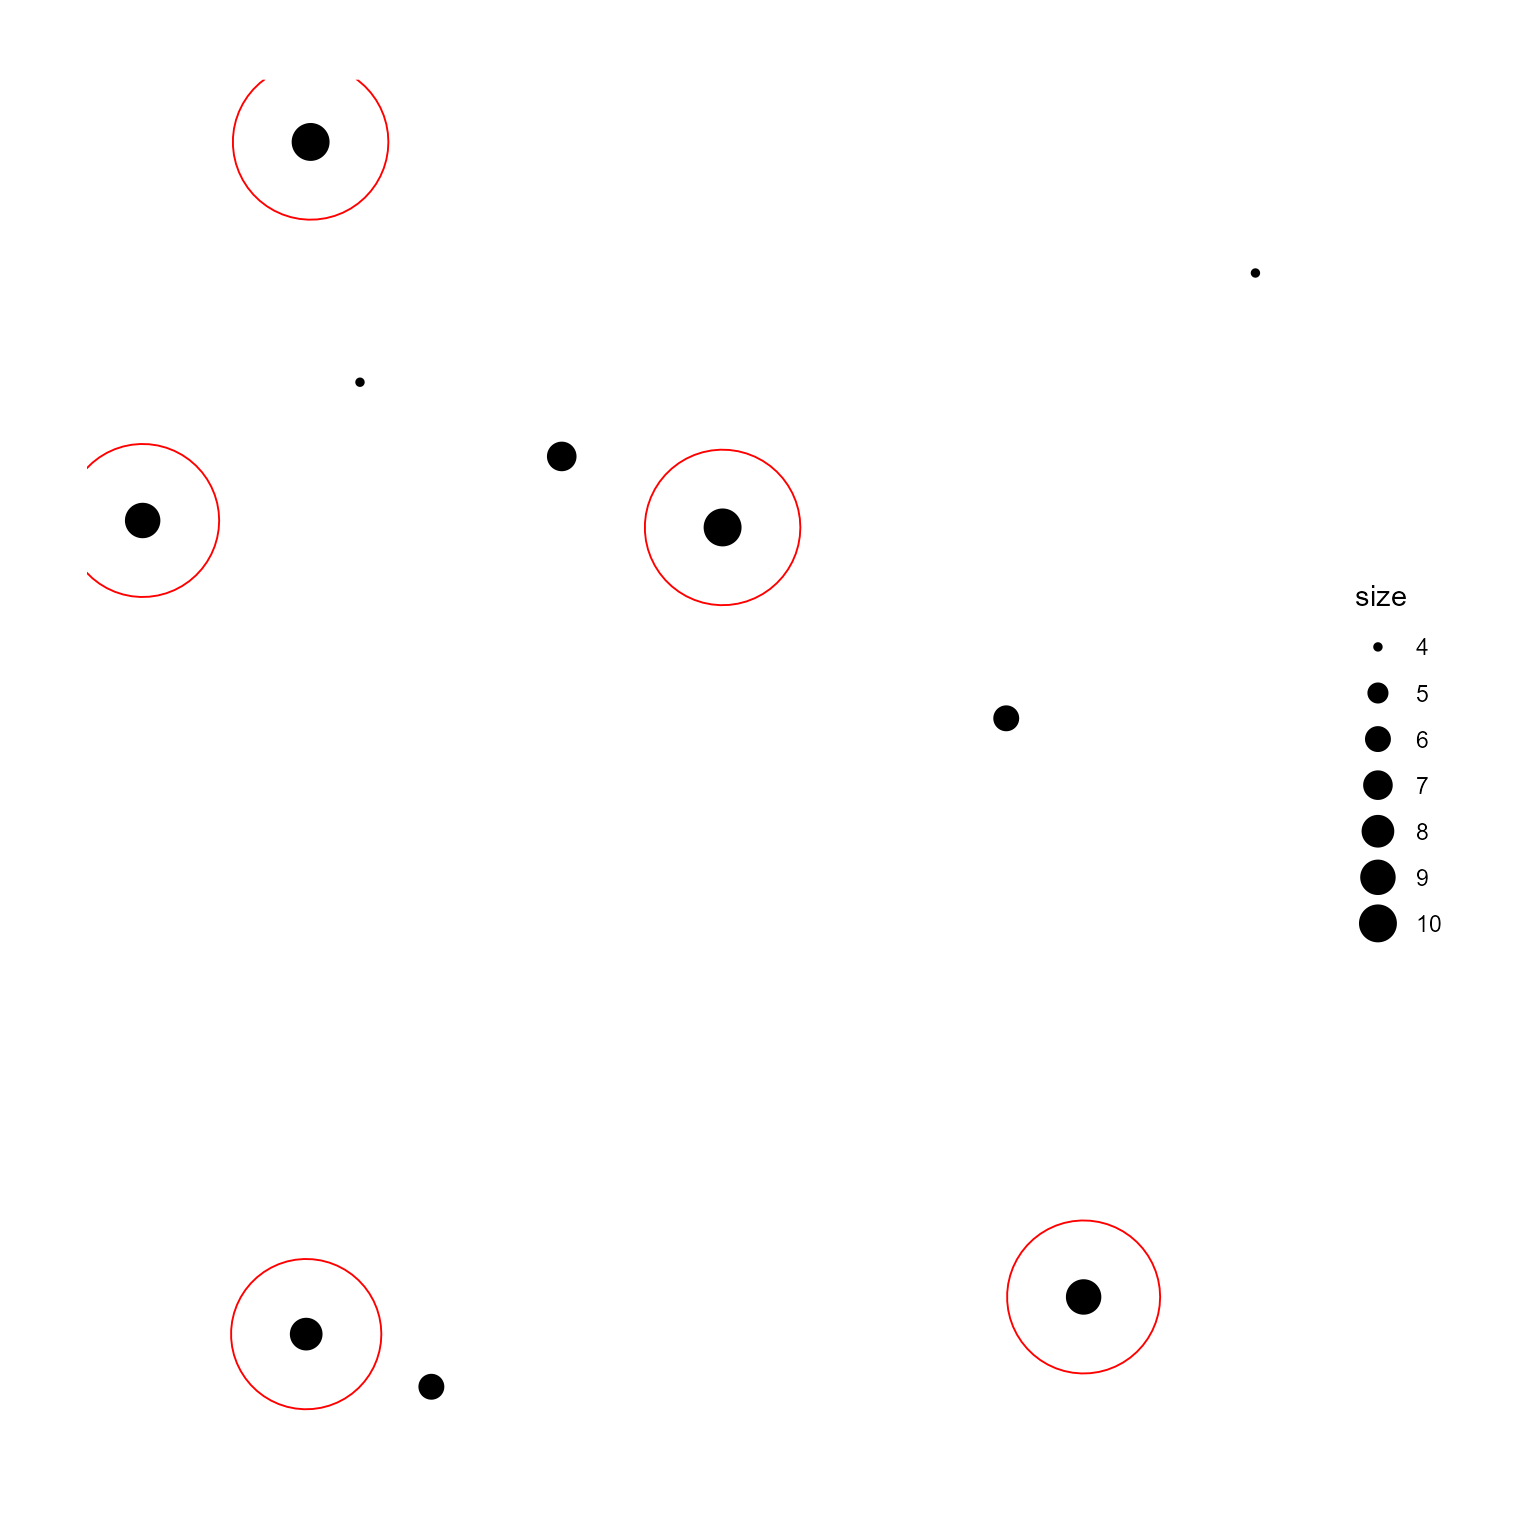
Or by making nodes glowing-look. The argument glow
should be set to TRUE. If no highlight_color
is specified, the raw colors of nodes are used.
ggraph(g, layout="nicely")+
geom_node_point(aes(size=size, color=size))+
scale_color_viridis()+
highlight_node(filter=size>7,glow=TRUE)+
theme_graph()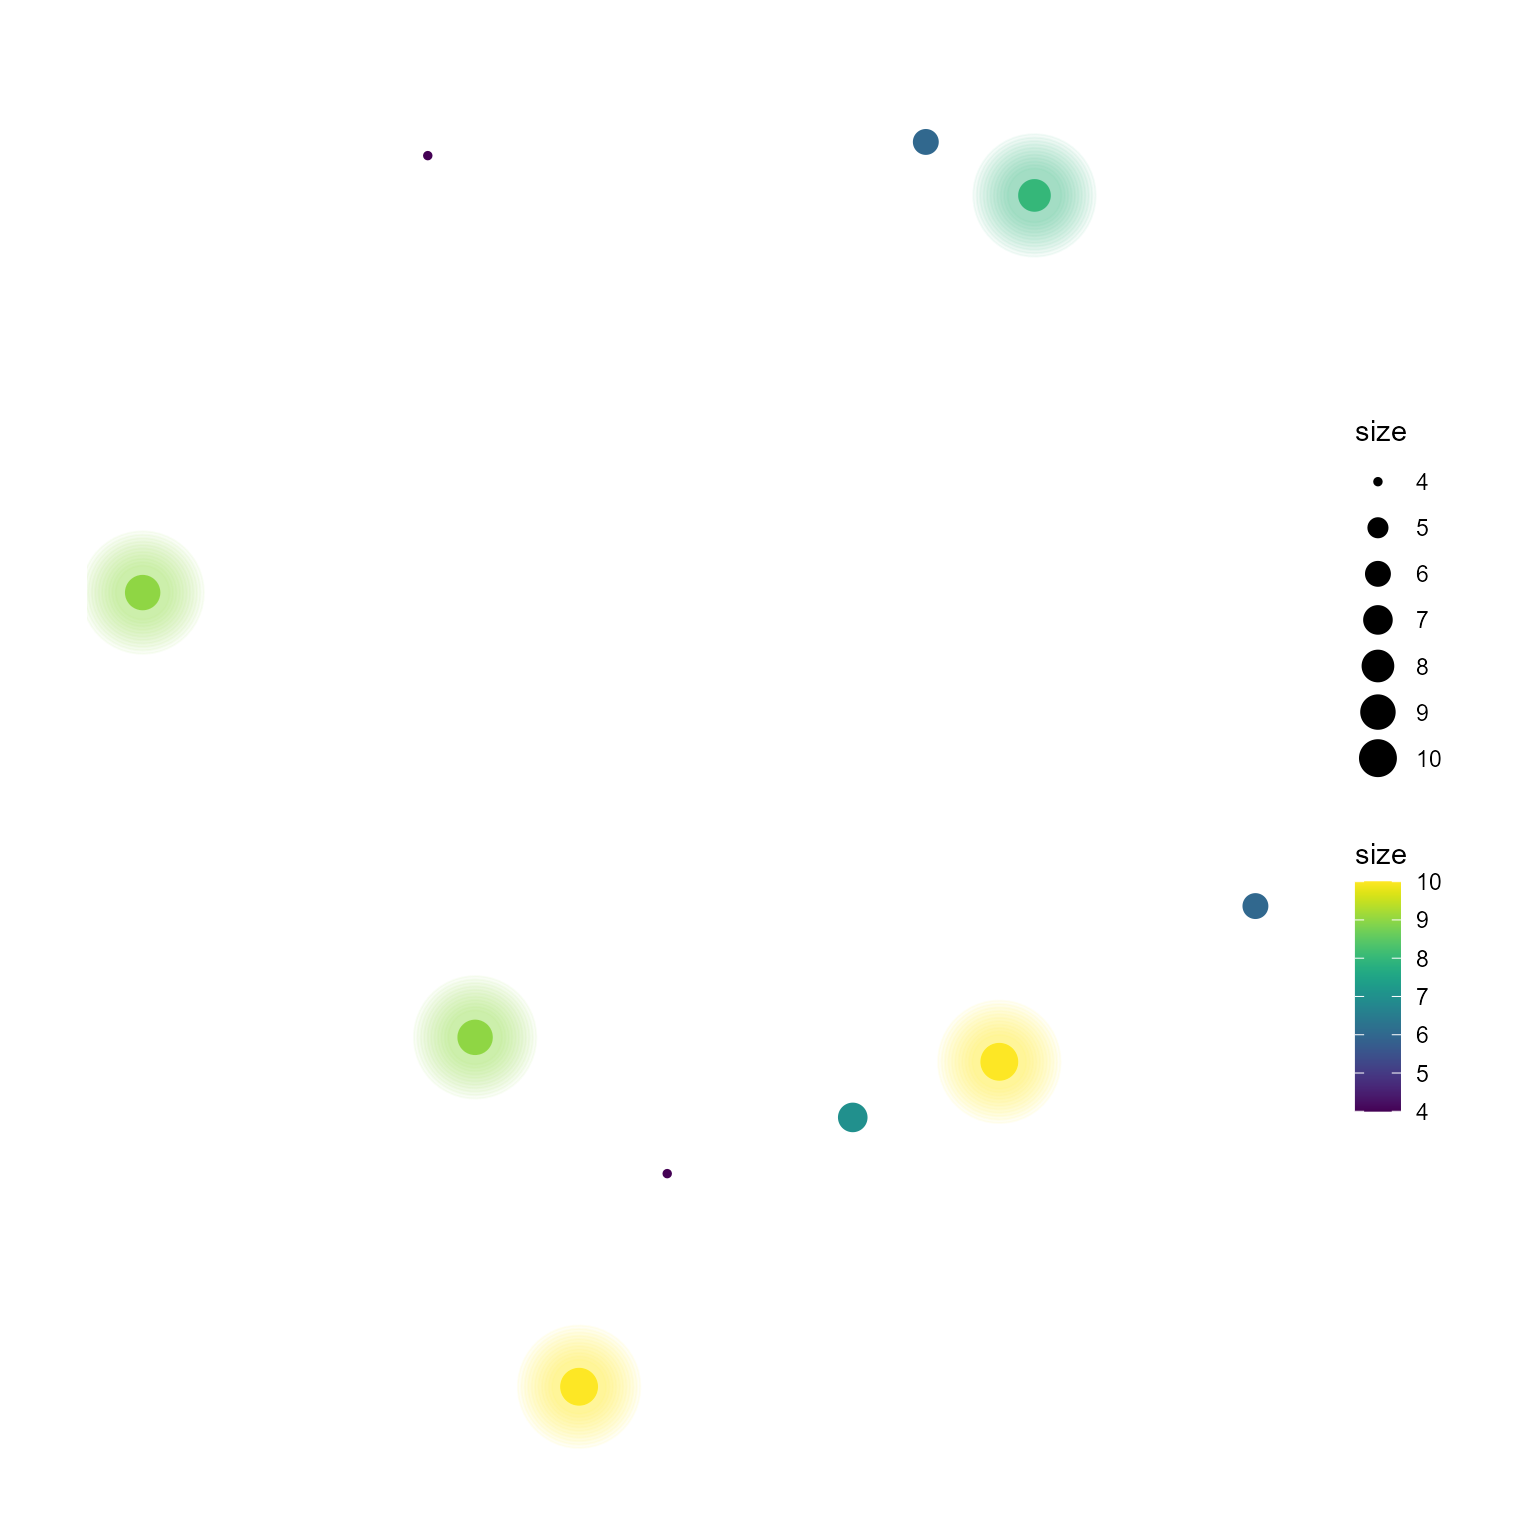 If
If highlight_color is specified, that color is used.
ggraph(g, layout="nicely")+
  geom_node_point(aes(size=size, color=size))+
  scale_color_viridis()+
  highlight_node(filter=size>7,glow=TRUE,
                 highlight_color="tomato")+
  theme_graph()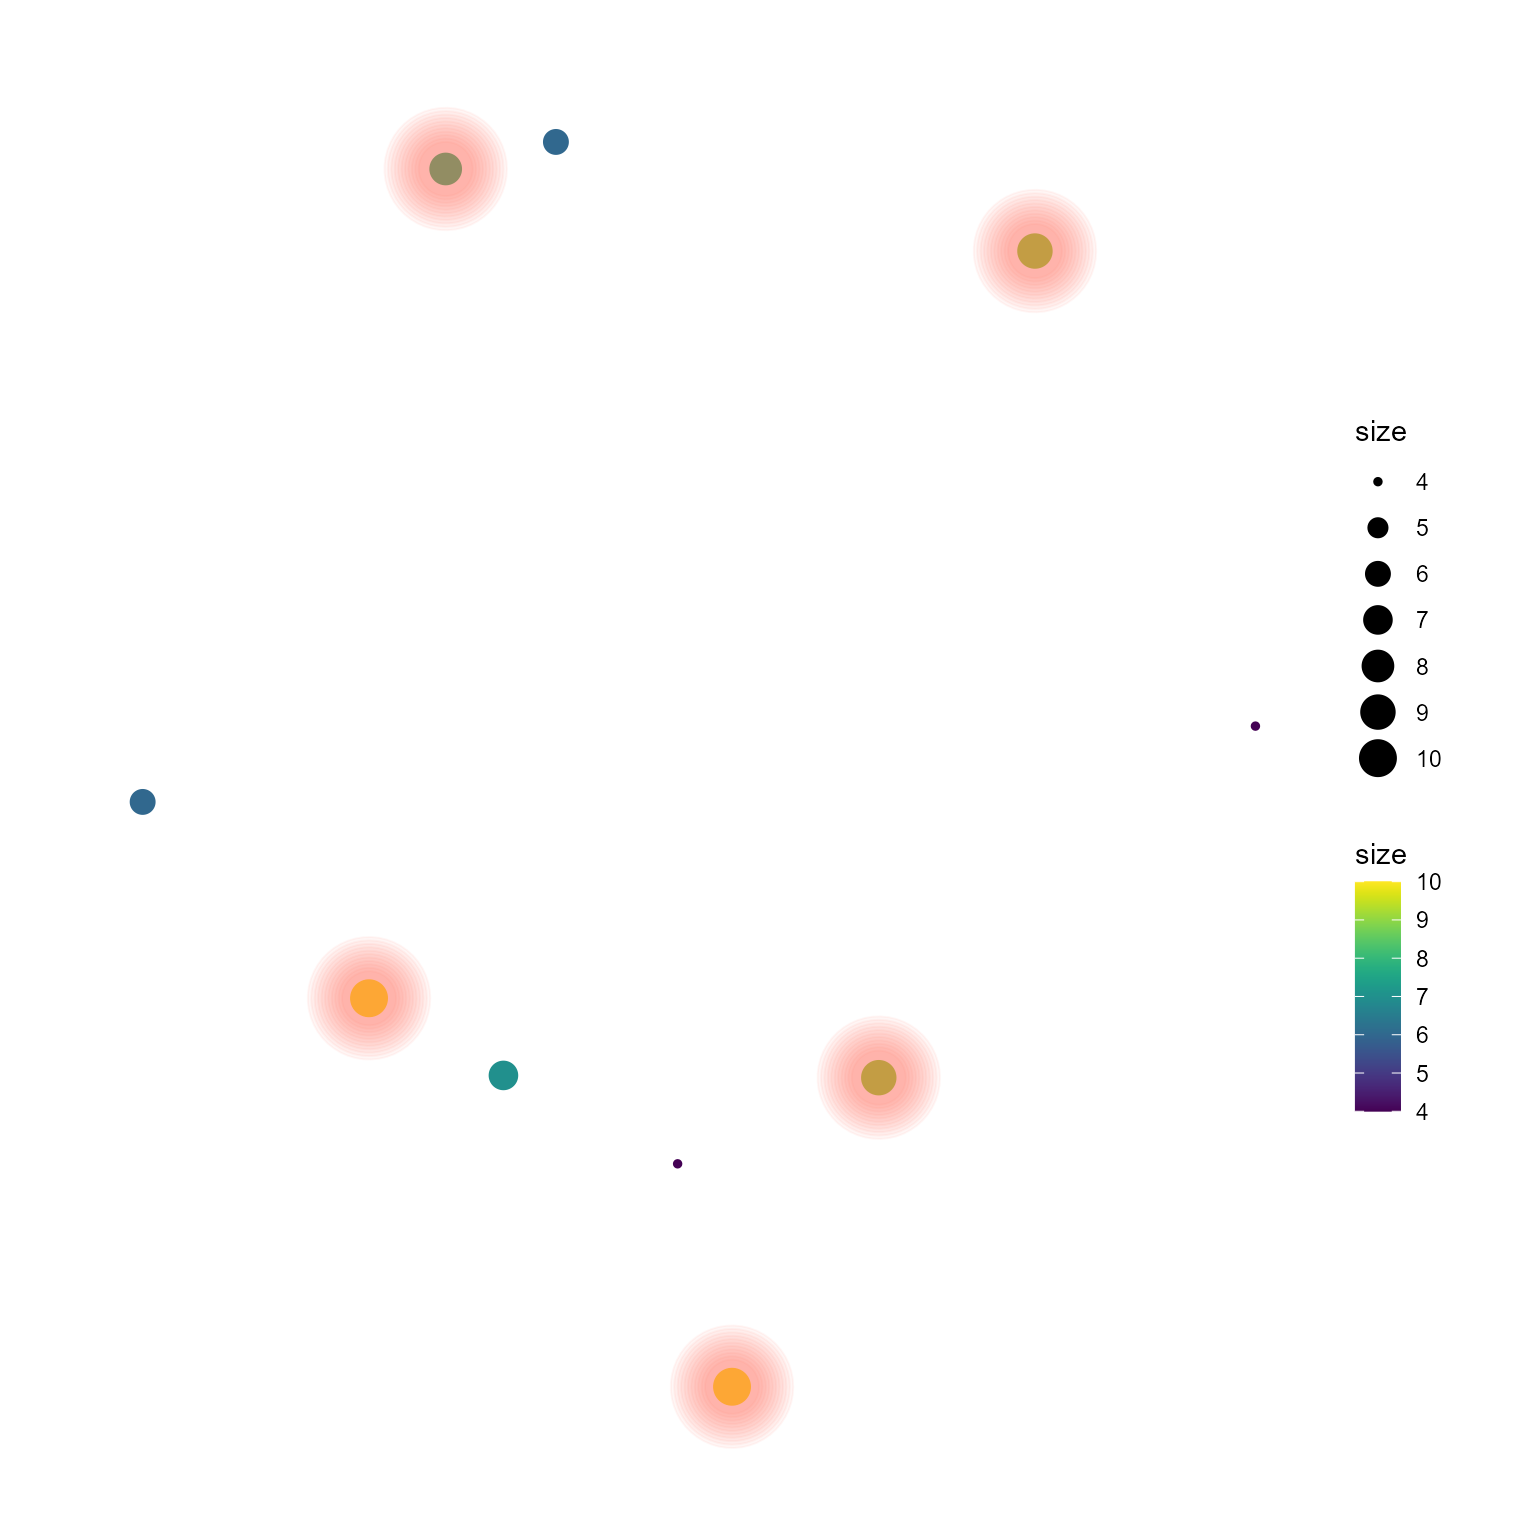
glow_size controls how big the glowing will be.
glow_base_size will use base node size for glowing.
Otherwise the same parameters are used for stacking the layers.
ggraph(g, layout="nicely")+
  geom_node_point(aes(size=size, color=size))+
  scale_color_viridis()+
  highlight_node(filter=size<7,glow=TRUE,
                 glow_size=5,
                 glow_base_size = TRUE)+
  theme_graph()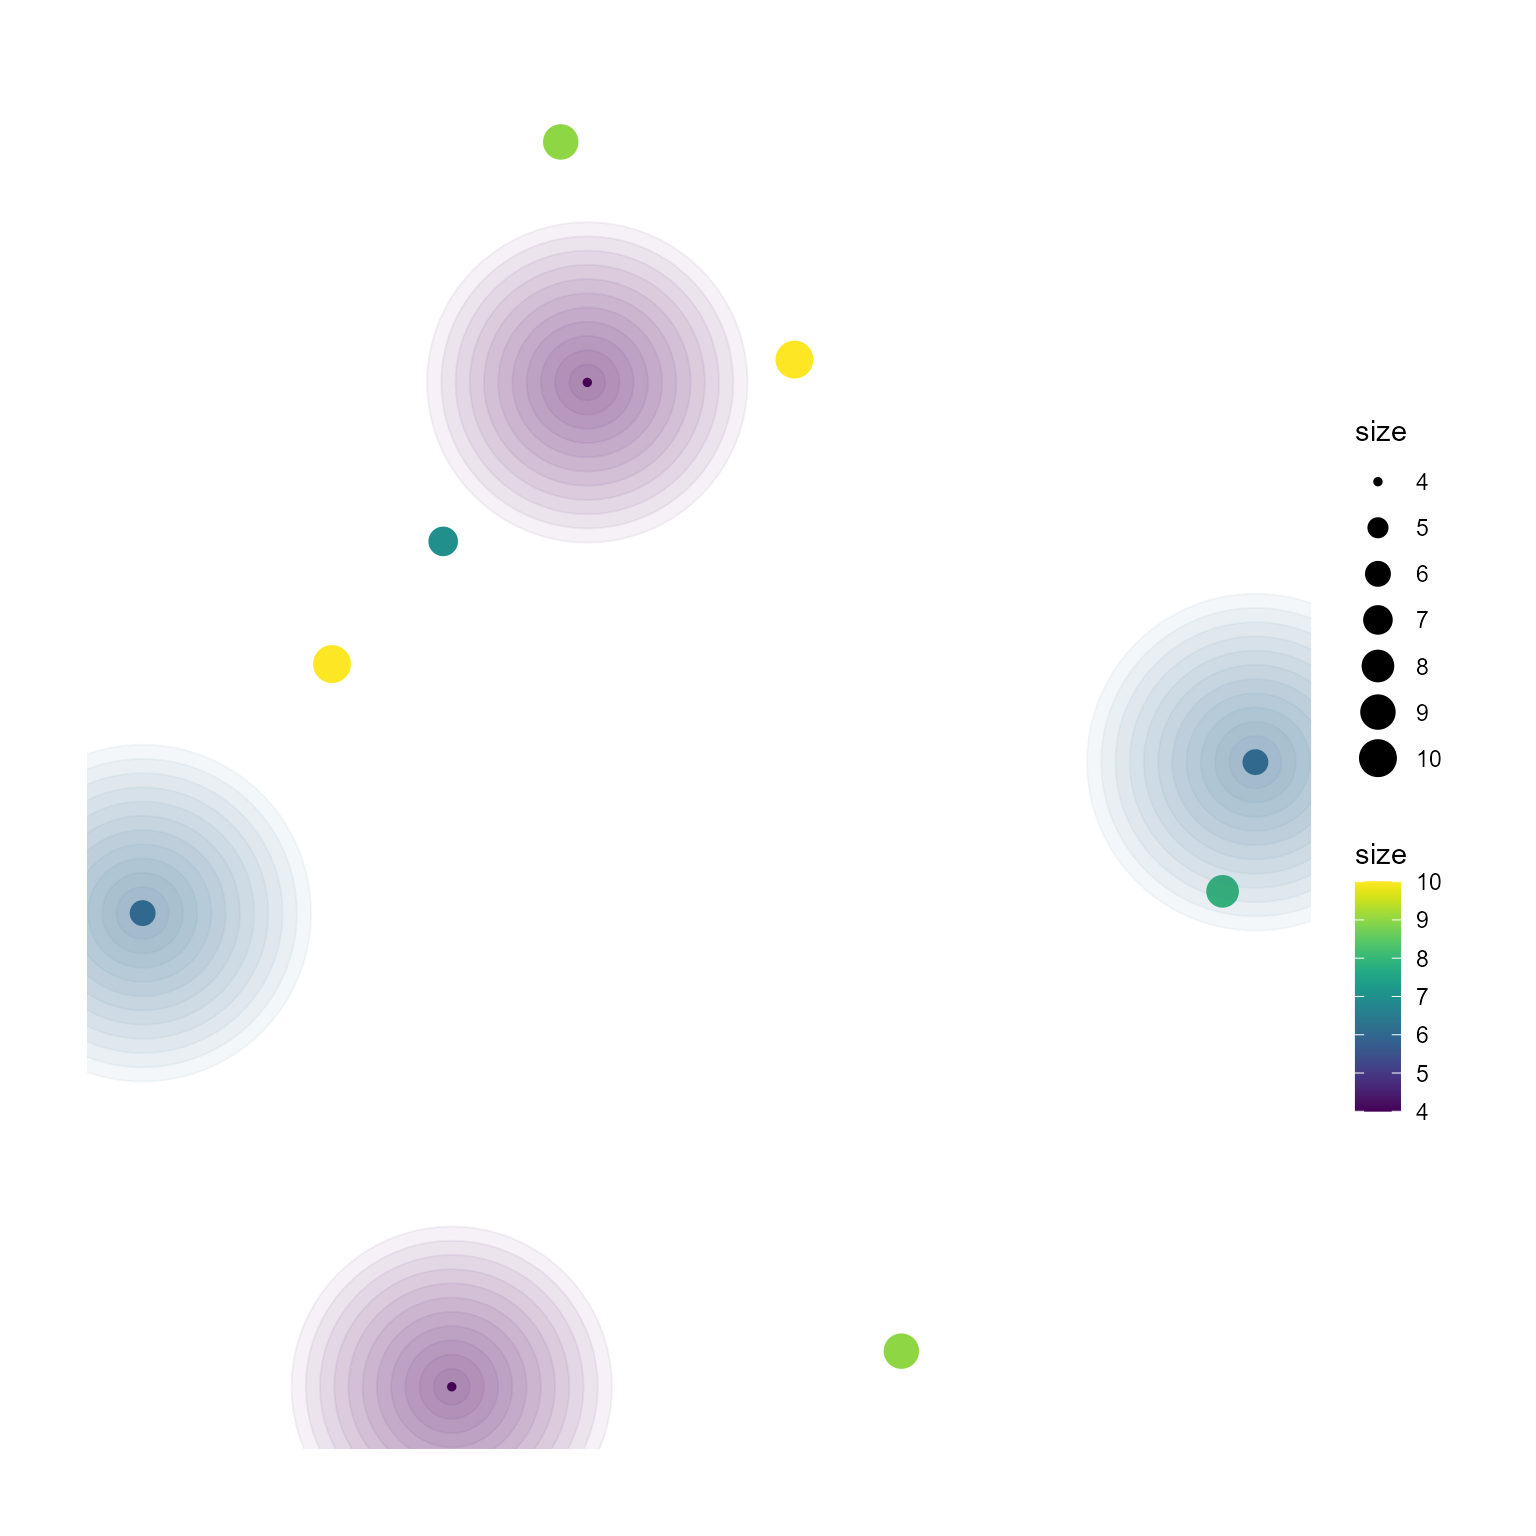
The same glowing function is implemented for highlighting edges in
highlight_edge, but not for
highlight_node_text as for the text,
shadowtext by Prof. Guangchuang Yu implmented in
geom_node_text and geom_text_repel can
highlight the text much better.
highlight_node and highlight_edge accept
various filter functions in ggfx, which can be specified by
use_ggfx and ggfx_params as parameters. This
is same as stacking the layer of geom_node_text with
filtering function.
library(ggfx)
ggraph(g, layout="nicely")+
  geom_node_point(aes(size=size, color=size))+
  scale_color_viridis()+
  highlight_node(filter=size<7,
                 use_ggfx="with_outer_glow",
                 ggfx_params=list(colour="red",expand=5))+
  theme_graph()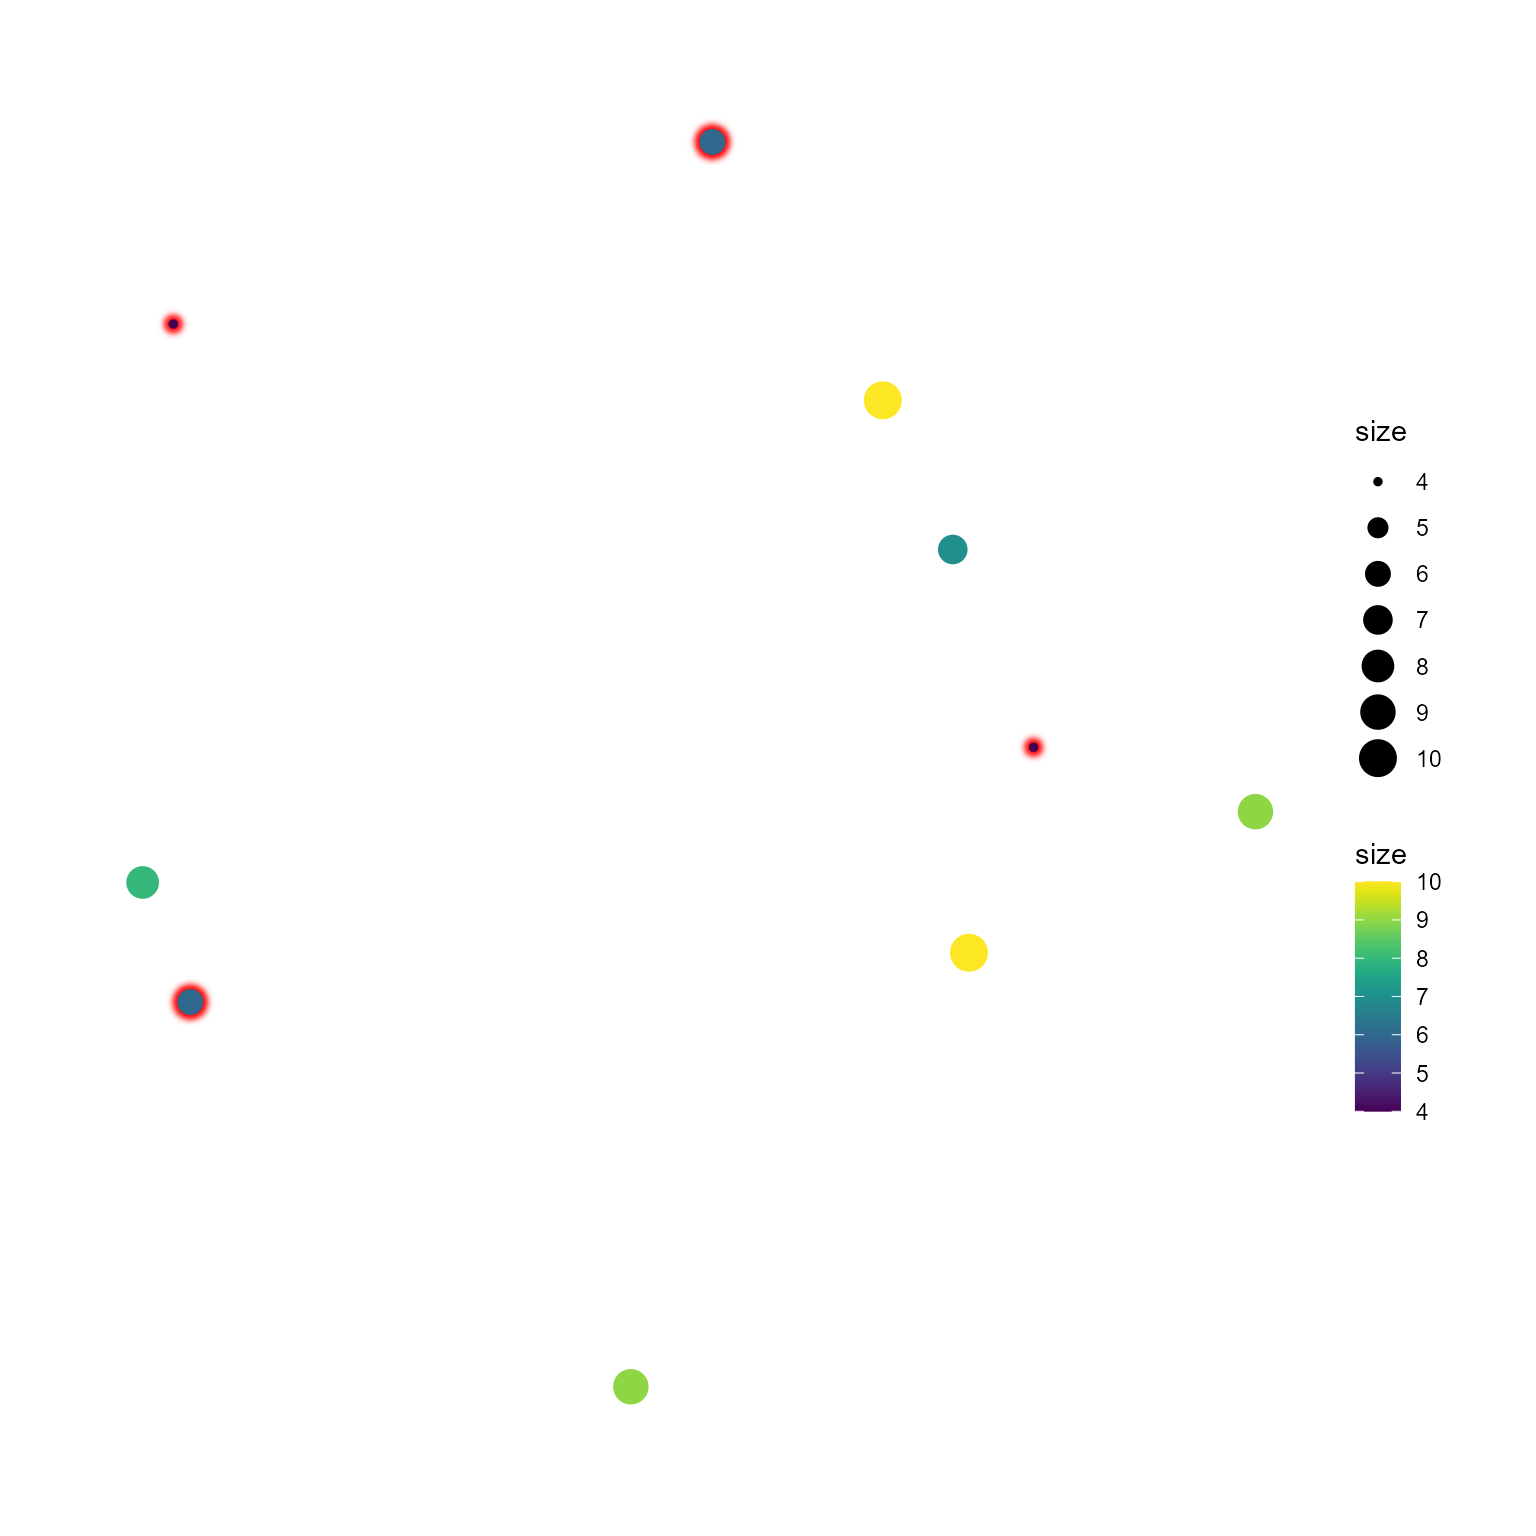
Further, using geom_textpath in
geomtextpath package, the text annotation can be added to
nodes.
library(geomtextpath)
ggraph(g, layout="kk")+
  geom_edge_link()+
  geom_node_point(aes(size=size, color=size))+
  scale_color_viridis()+
  highlight_node(filter=size>7,
                 shape_with_text = "this node is interesting",
                 shape_size = 21,
                 textpath_params=list(size=3,
                  text_only=TRUE,
                  offset=unit(5,"mm"),
                  bg.colour="grey"))+
  coord_fixed()+
  theme_graph()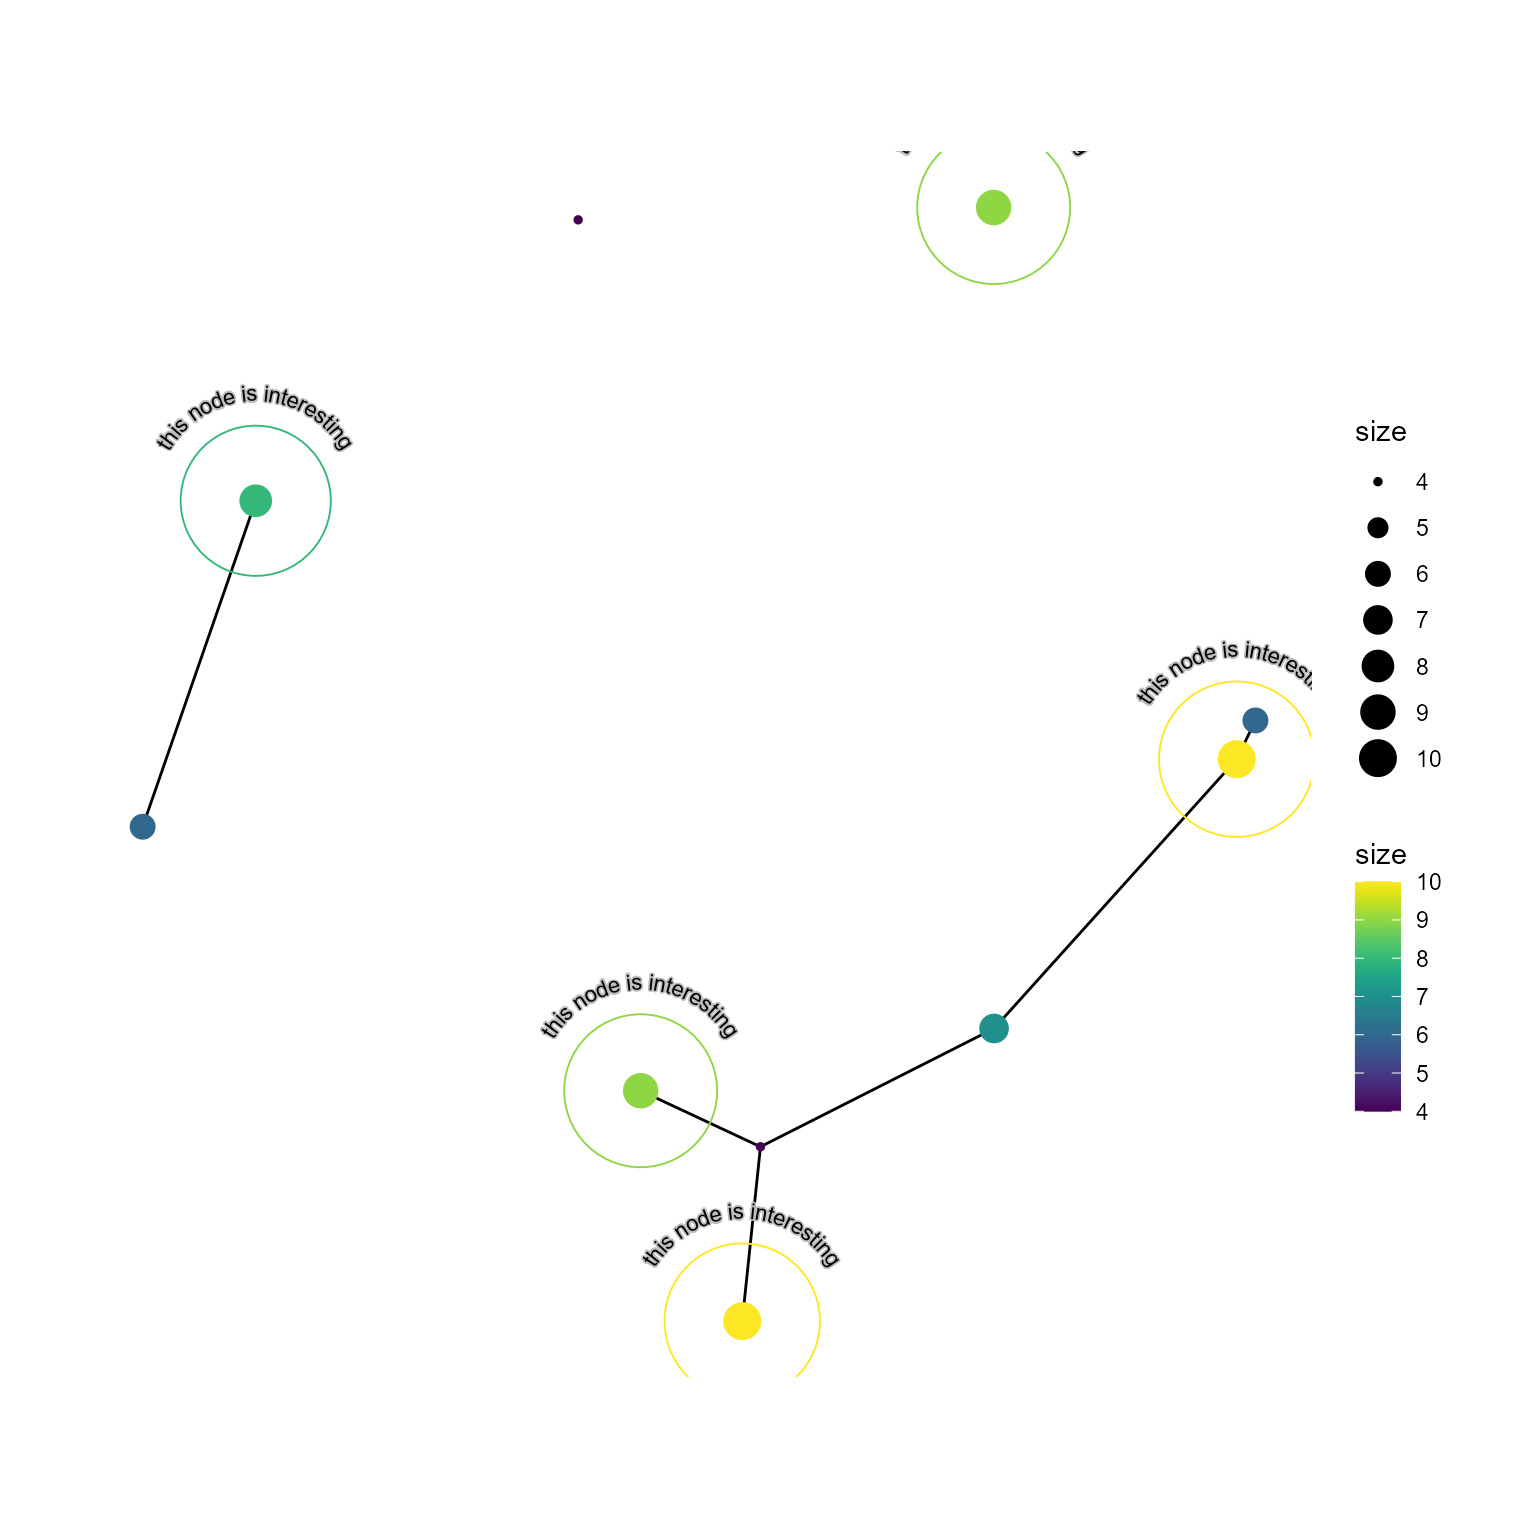
By default, texts specified in shape_with_text or
with_text (without the shape) is annotated to all the
nodes. If text_attribute is set, the node attributes of the
same name is taken and plotted like the example below.
text_attribute will override the former parameters. If
text_node_color is set to TRUE, node color
will be used as text color.
V(g)$text <- unlist(strsplit(stringi::stri_rand_lipsum(1), " "))[1:length(V(g))]
ggraph(g, layout="nicely")+
  geom_edge_link()+
  geom_node_point(aes(size=size, color=size))+
  scale_color_viridis()+
  highlight_node(filter=size>7,
                 with_text = "this node is interesting", # whatever not NULL
                 text_attribute="text",
                 text_node_color=TRUE,
                 textpath_params=list(size=3,
                  text_only=TRUE,
                  offset=unit(4,"mm"),
                  bg.colour="black"))+
  coord_fixed()+
  theme_graph()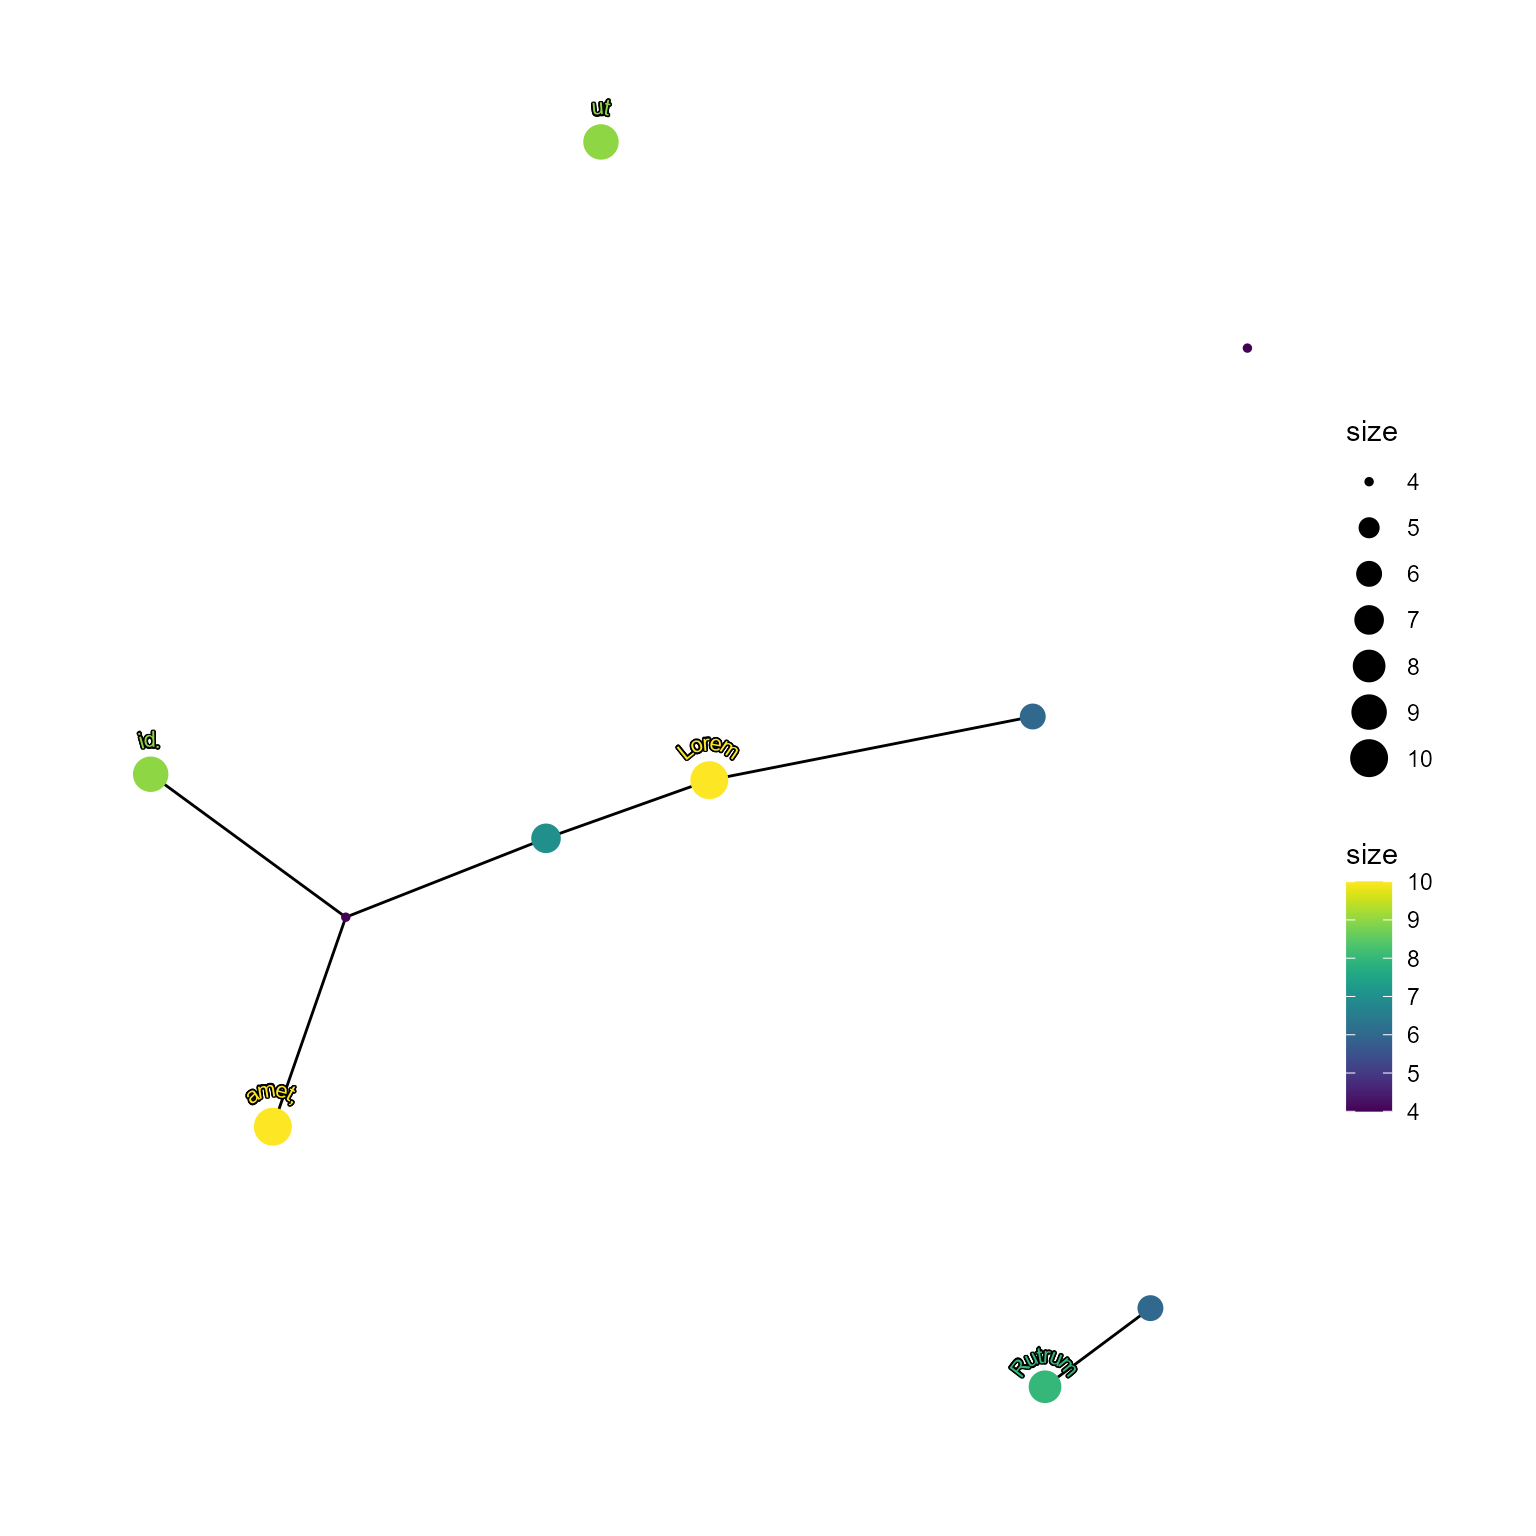
highlight_edge
Edges can be highlighted in the same way as
highlight_node.
ggraph(g, layout="nicely")+
  geom_edge_diagonal(aes(width=weight,
                         color=weight))+
  scale_edge_color_gradient(low="blue",high="red")+
  highlight_edge(filter=weight>7,
                 highlight_color="pink")+
  theme_graph()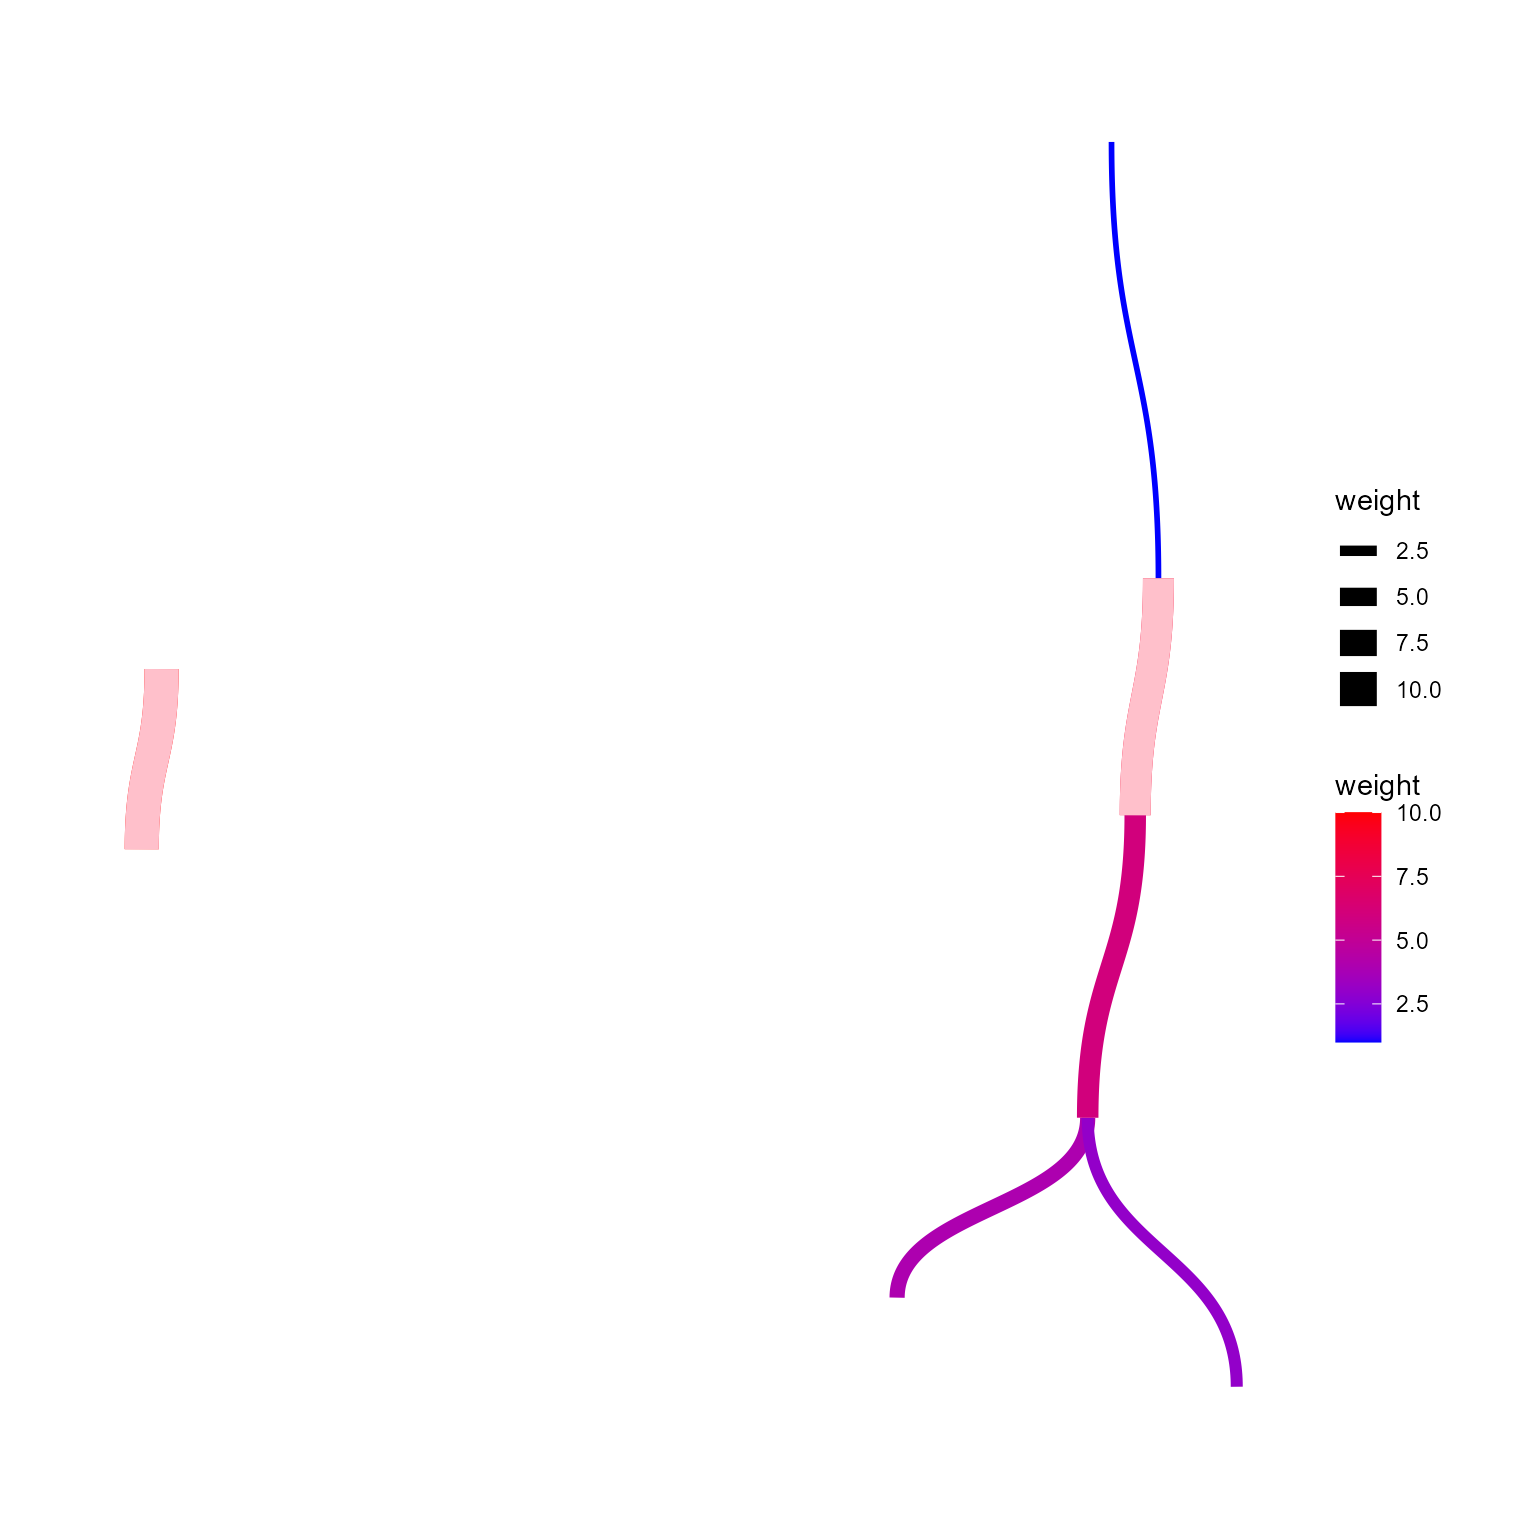
The same can be performed for the other geoms.
ggraph(g, layout="nicely")+
  geom_edge_bend2(aes(width=weight,
                         color=weight))+
  scale_edge_color_gradient(low="blue",high="red")+
  highlight_edge(filter=weight>7,
                 highlight_color="pink")+
  theme_graph()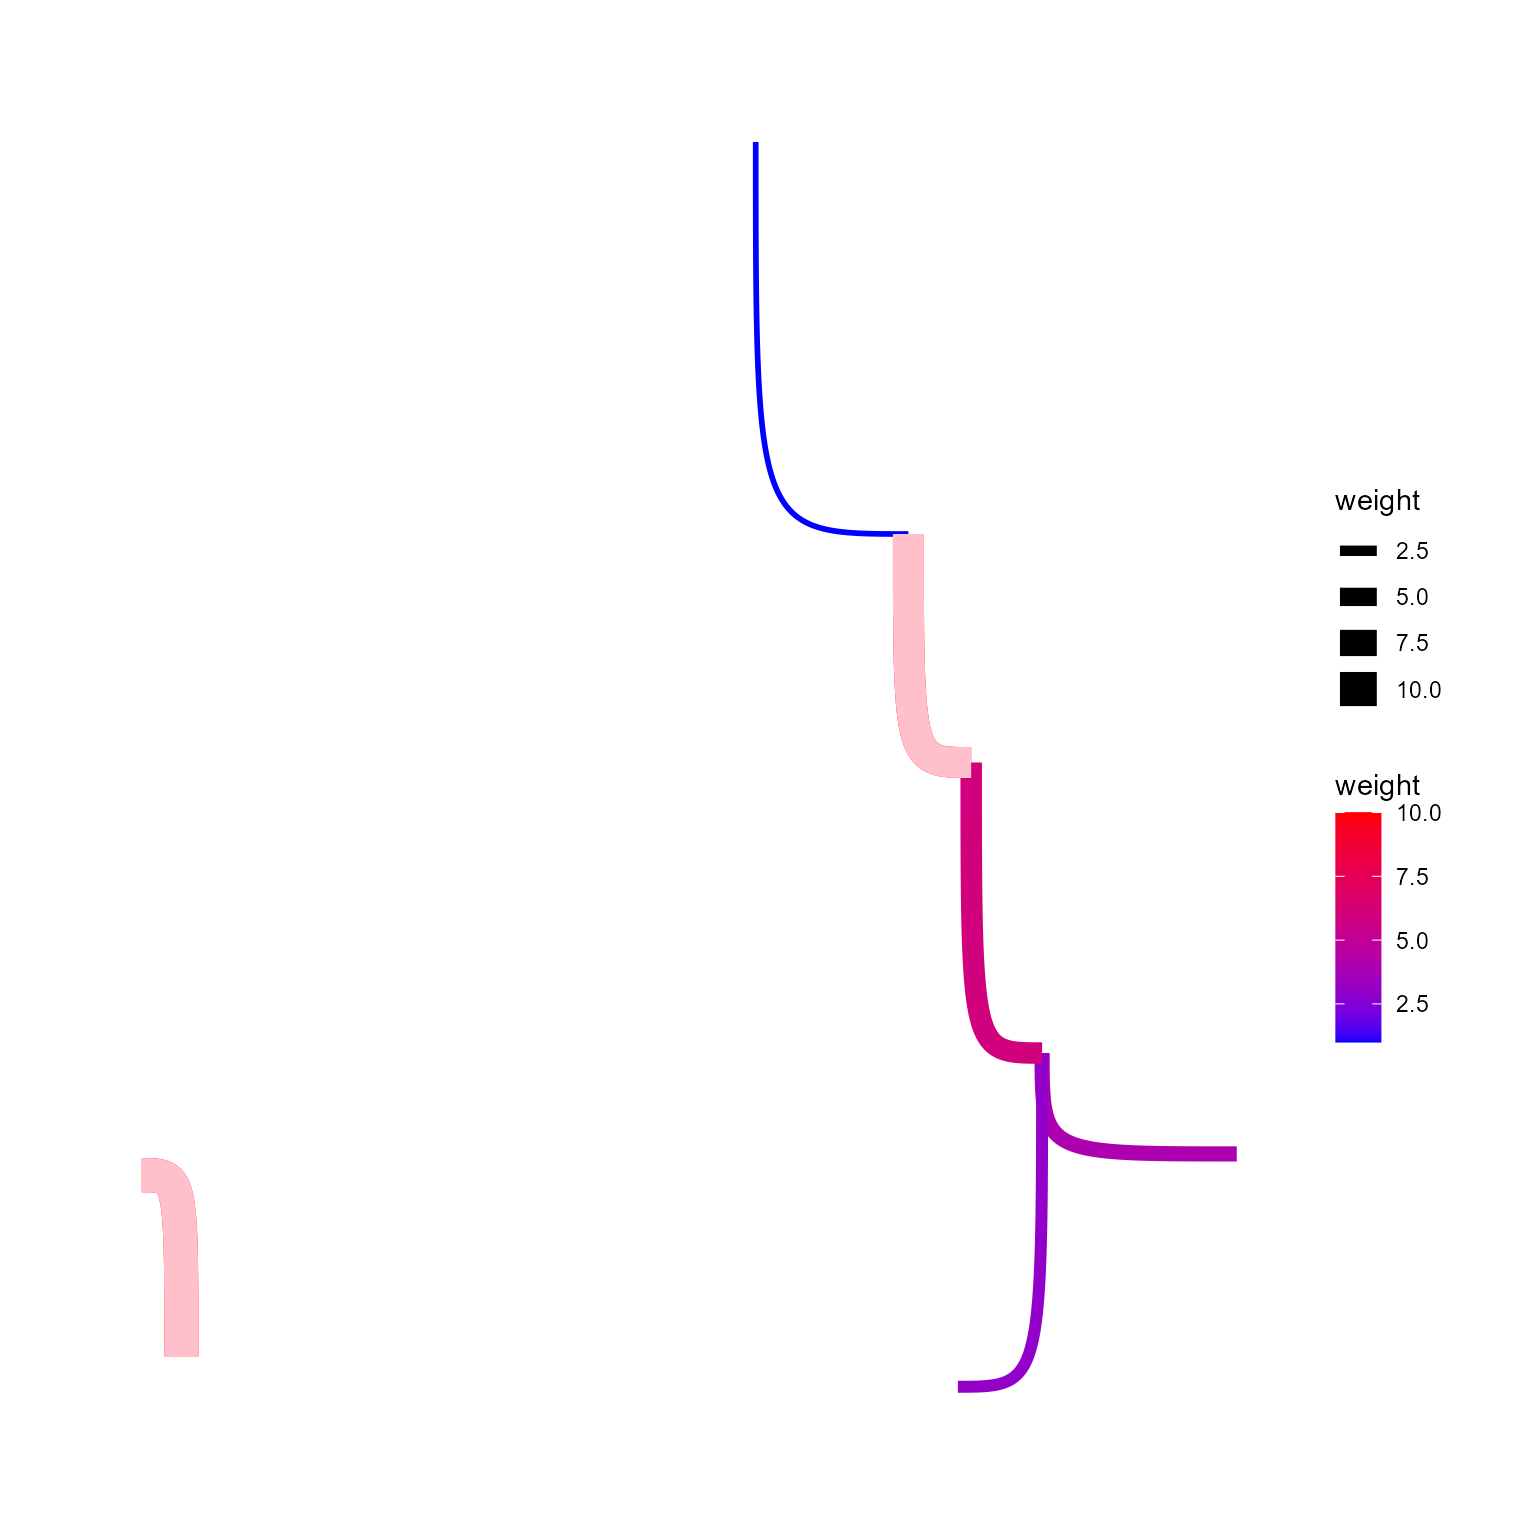
With the arrows.
ggraph(g, layout="nicely")+
  geom_edge_link(aes(width=weight),
              arrow = arrow(length = unit(4, 'mm')),
              end_cap = circle(5, 'mm'),
              start_cap = circle(5, "mm"))+
  highlight_edge(filter=weight<5,
                 highlight_color="steelblue")+
  theme_graph()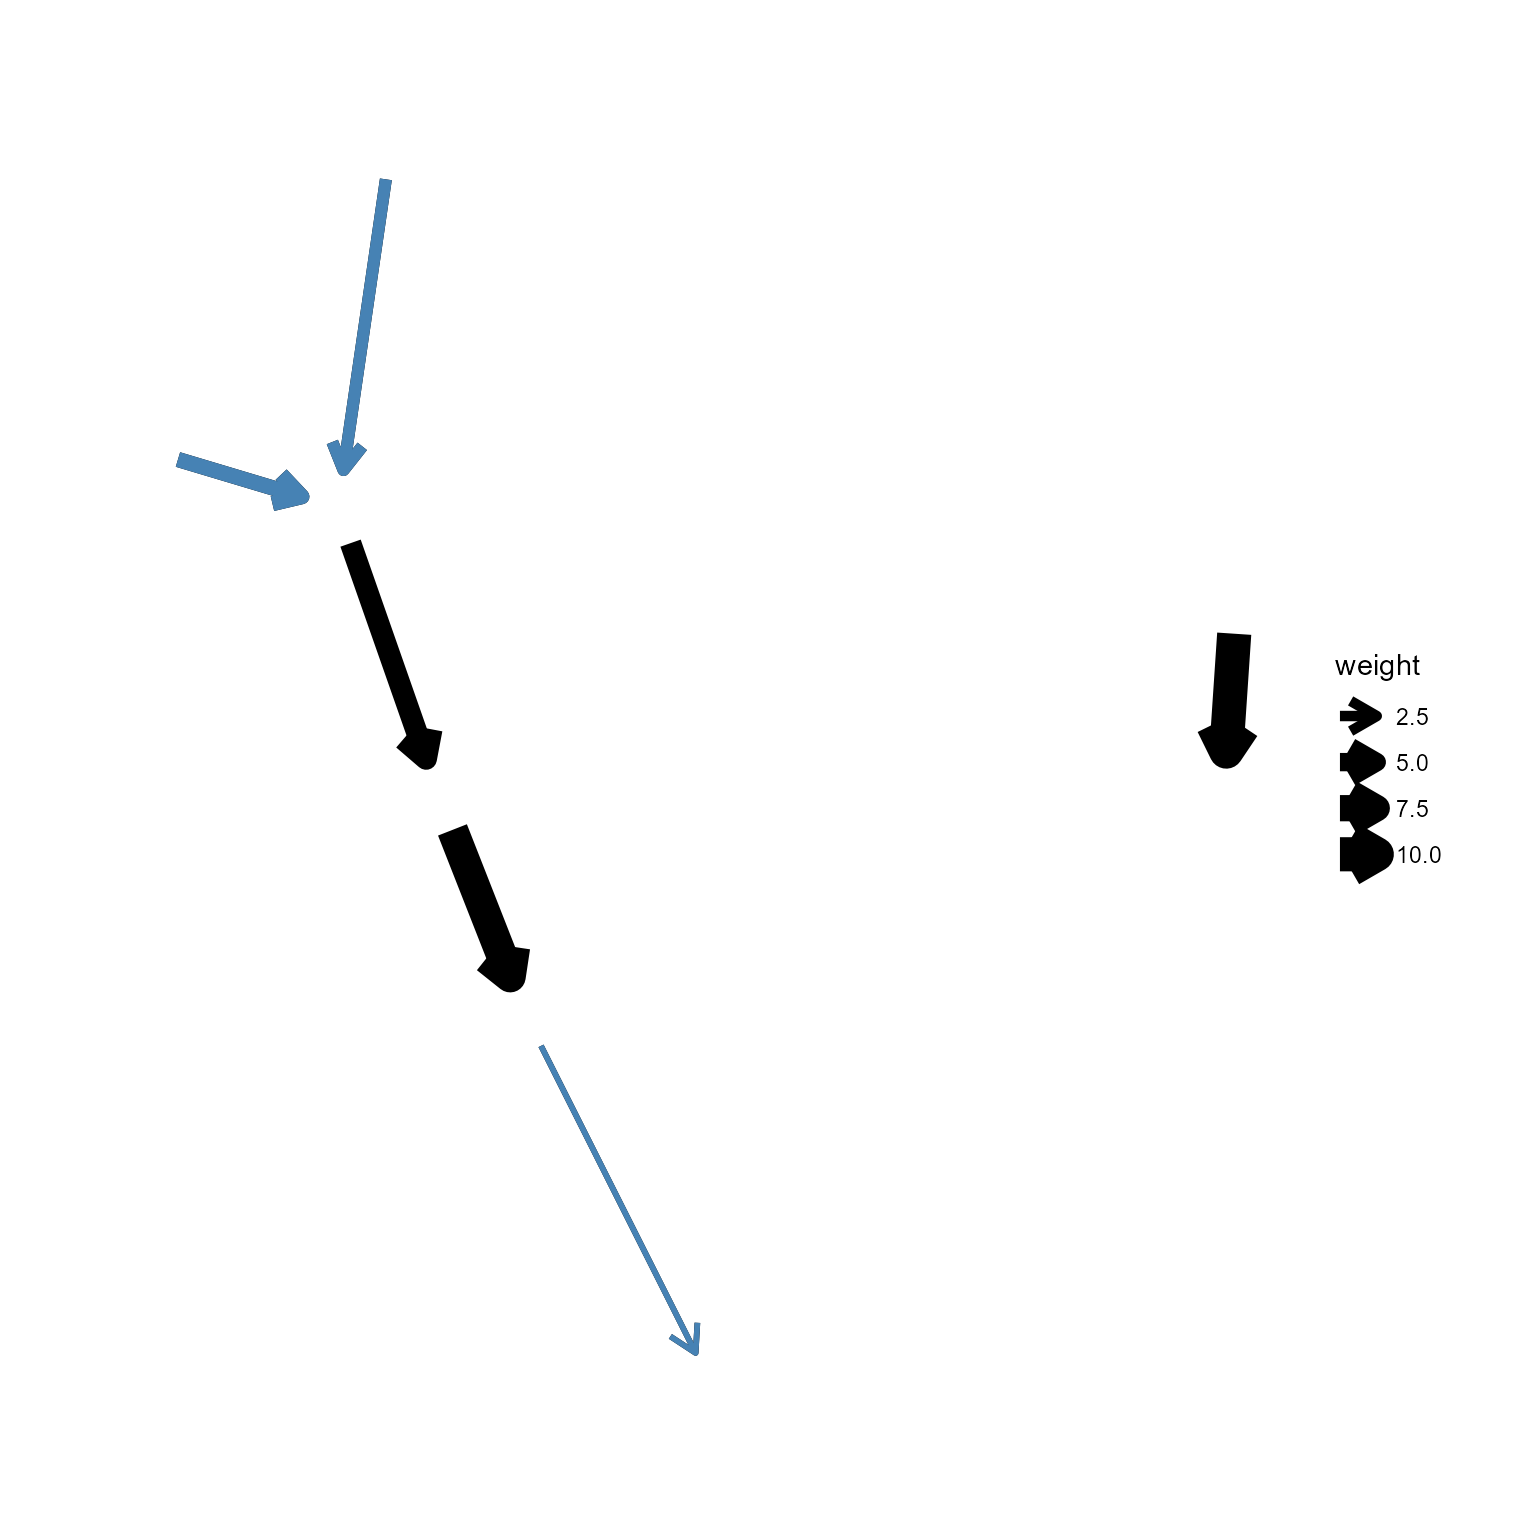
Glowing function can be applied by specifying glow to
TRUE. geom_edge_size controls how big the
glowing will be. Note that specifying big number will deteriorate the
looking.
ggraph(g, layout="nicely")+
  geom_edge_link(aes(width=weight),
              arrow = arrow(length = unit(4, 'mm')),
              end_cap = circle(5, 'mm'),
              start_cap = circle(5, "mm"))+
  highlight_edge(filter=weight<5,
                 glow=TRUE,
                 highlight_color="steelblue",
                 glow_edge_size =0.5,
                 glow_fixed_color = TRUE,
                 glow_base_size =TRUE )+
  theme_graph()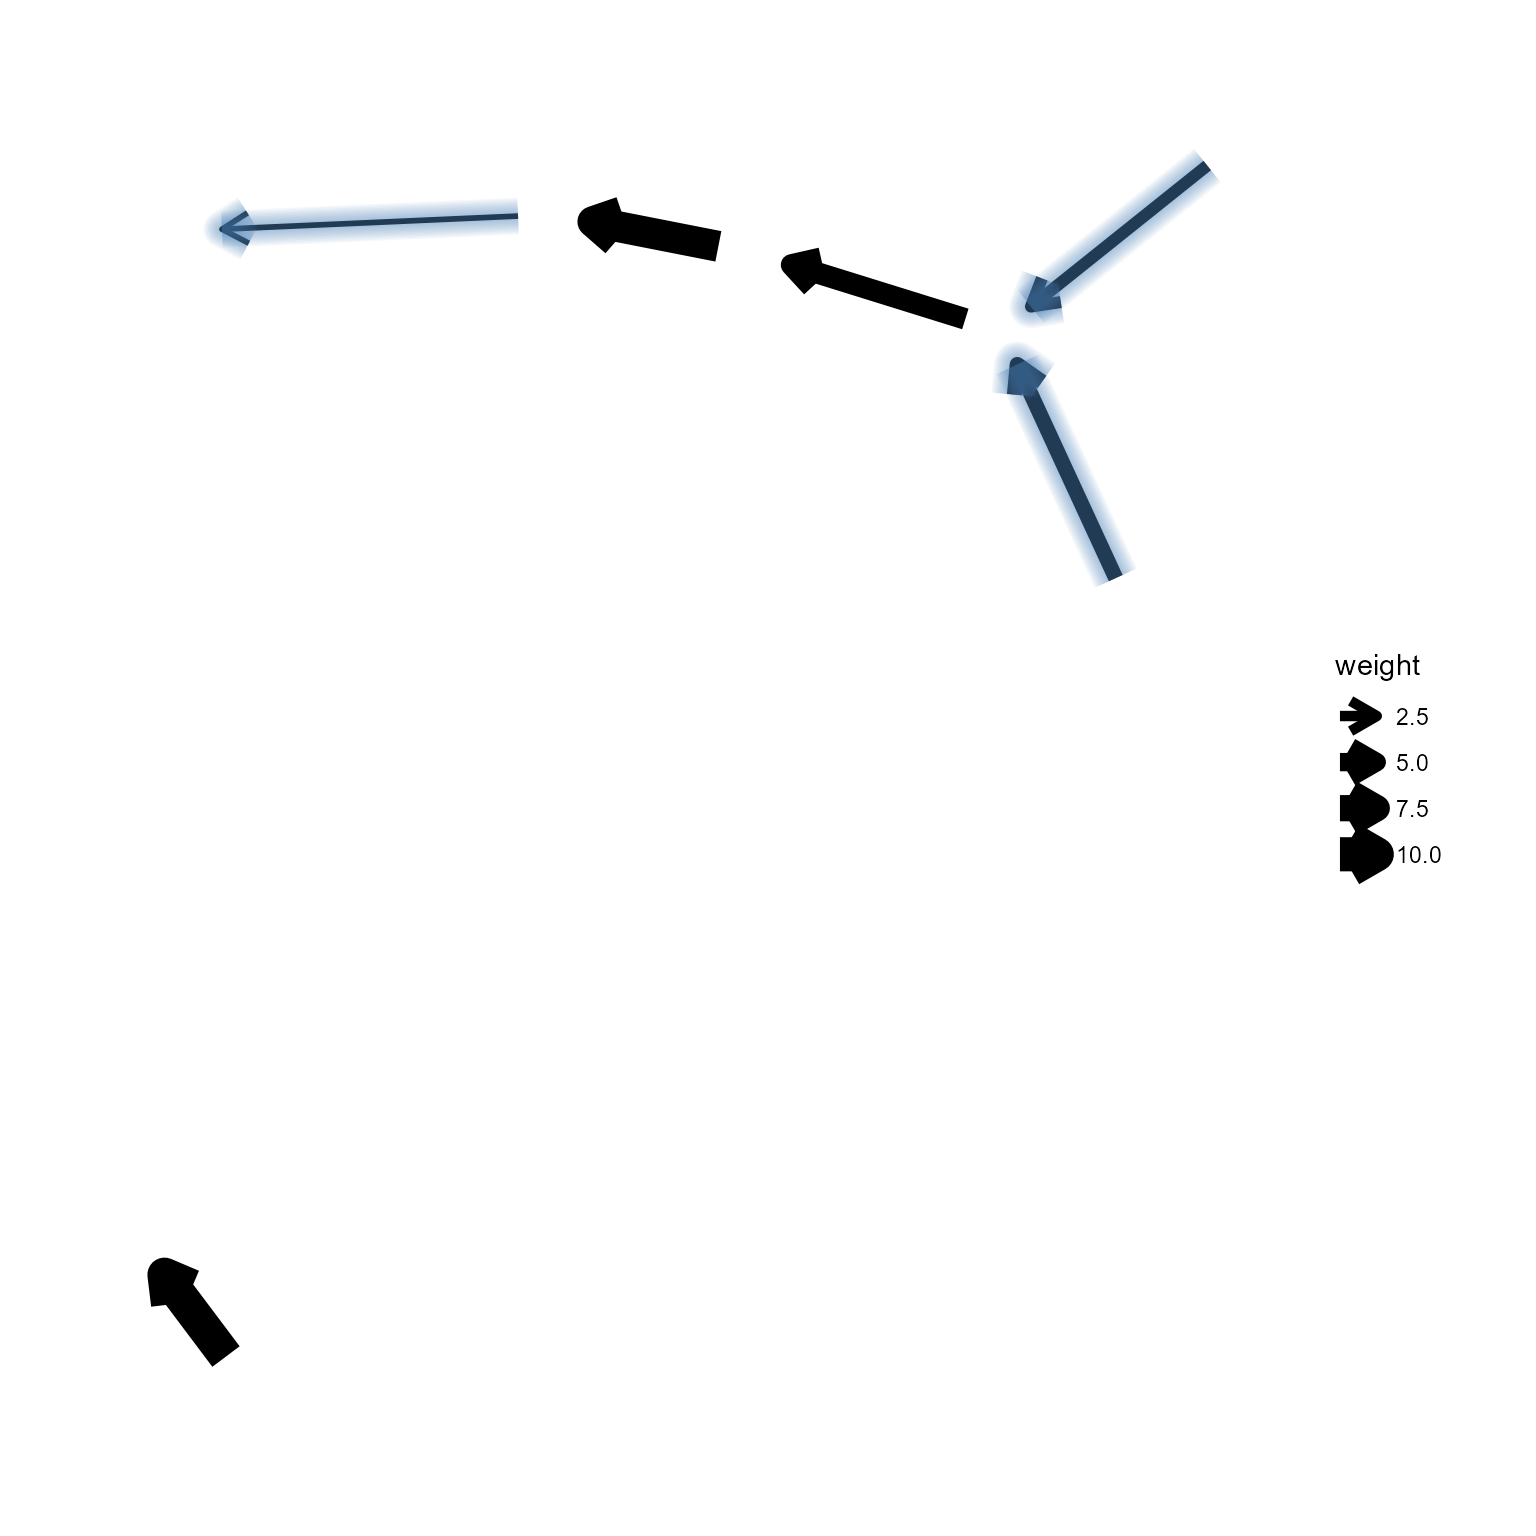
Coloring of edge labels is controlled by
change_label_color.
ggraph(g, layout="nicely")+
  geom_edge_link(aes(width=weight,
                     label=weight),
              angle_calc="along",
              label_dodge = unit(5, 'mm'),
              position="identity",
              arrow = arrow(length = unit(4, 'mm')),
              end_cap = circle(5, 'mm'),
              start_cap = circle(5, "mm"))+
  highlight_edge(filter=weight>5,
                 change_label_color=TRUE,
                 highlight_color="red")+
  theme_graph()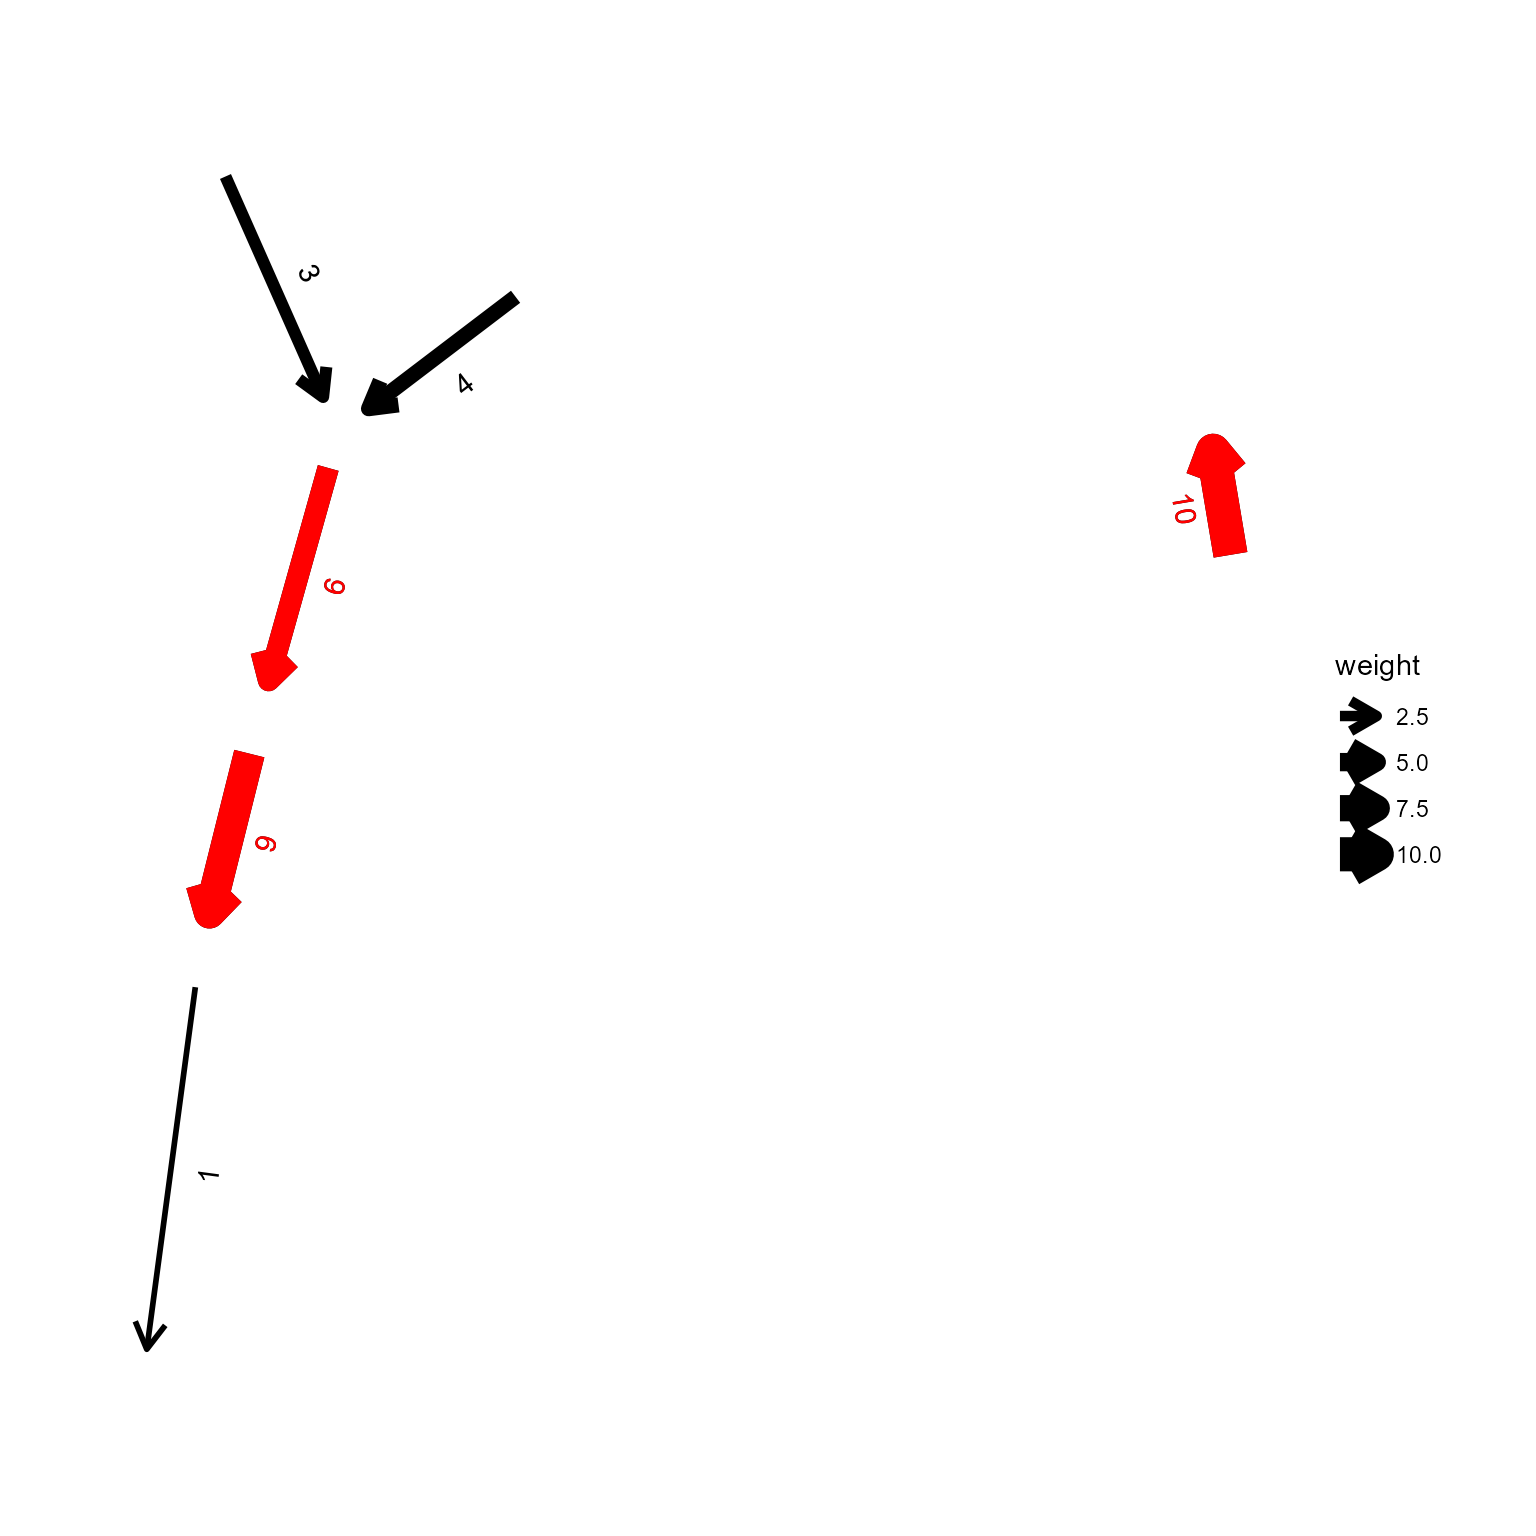
highlight_node_text
ggraph(g, layout="nicely")+
  geom_node_text(aes(label=name, color=size, size=size), repel=TRUE, bg.colour="grey")+
  highlight_node_text(filter=size>6,highlight_color = "red")+
  theme_graph()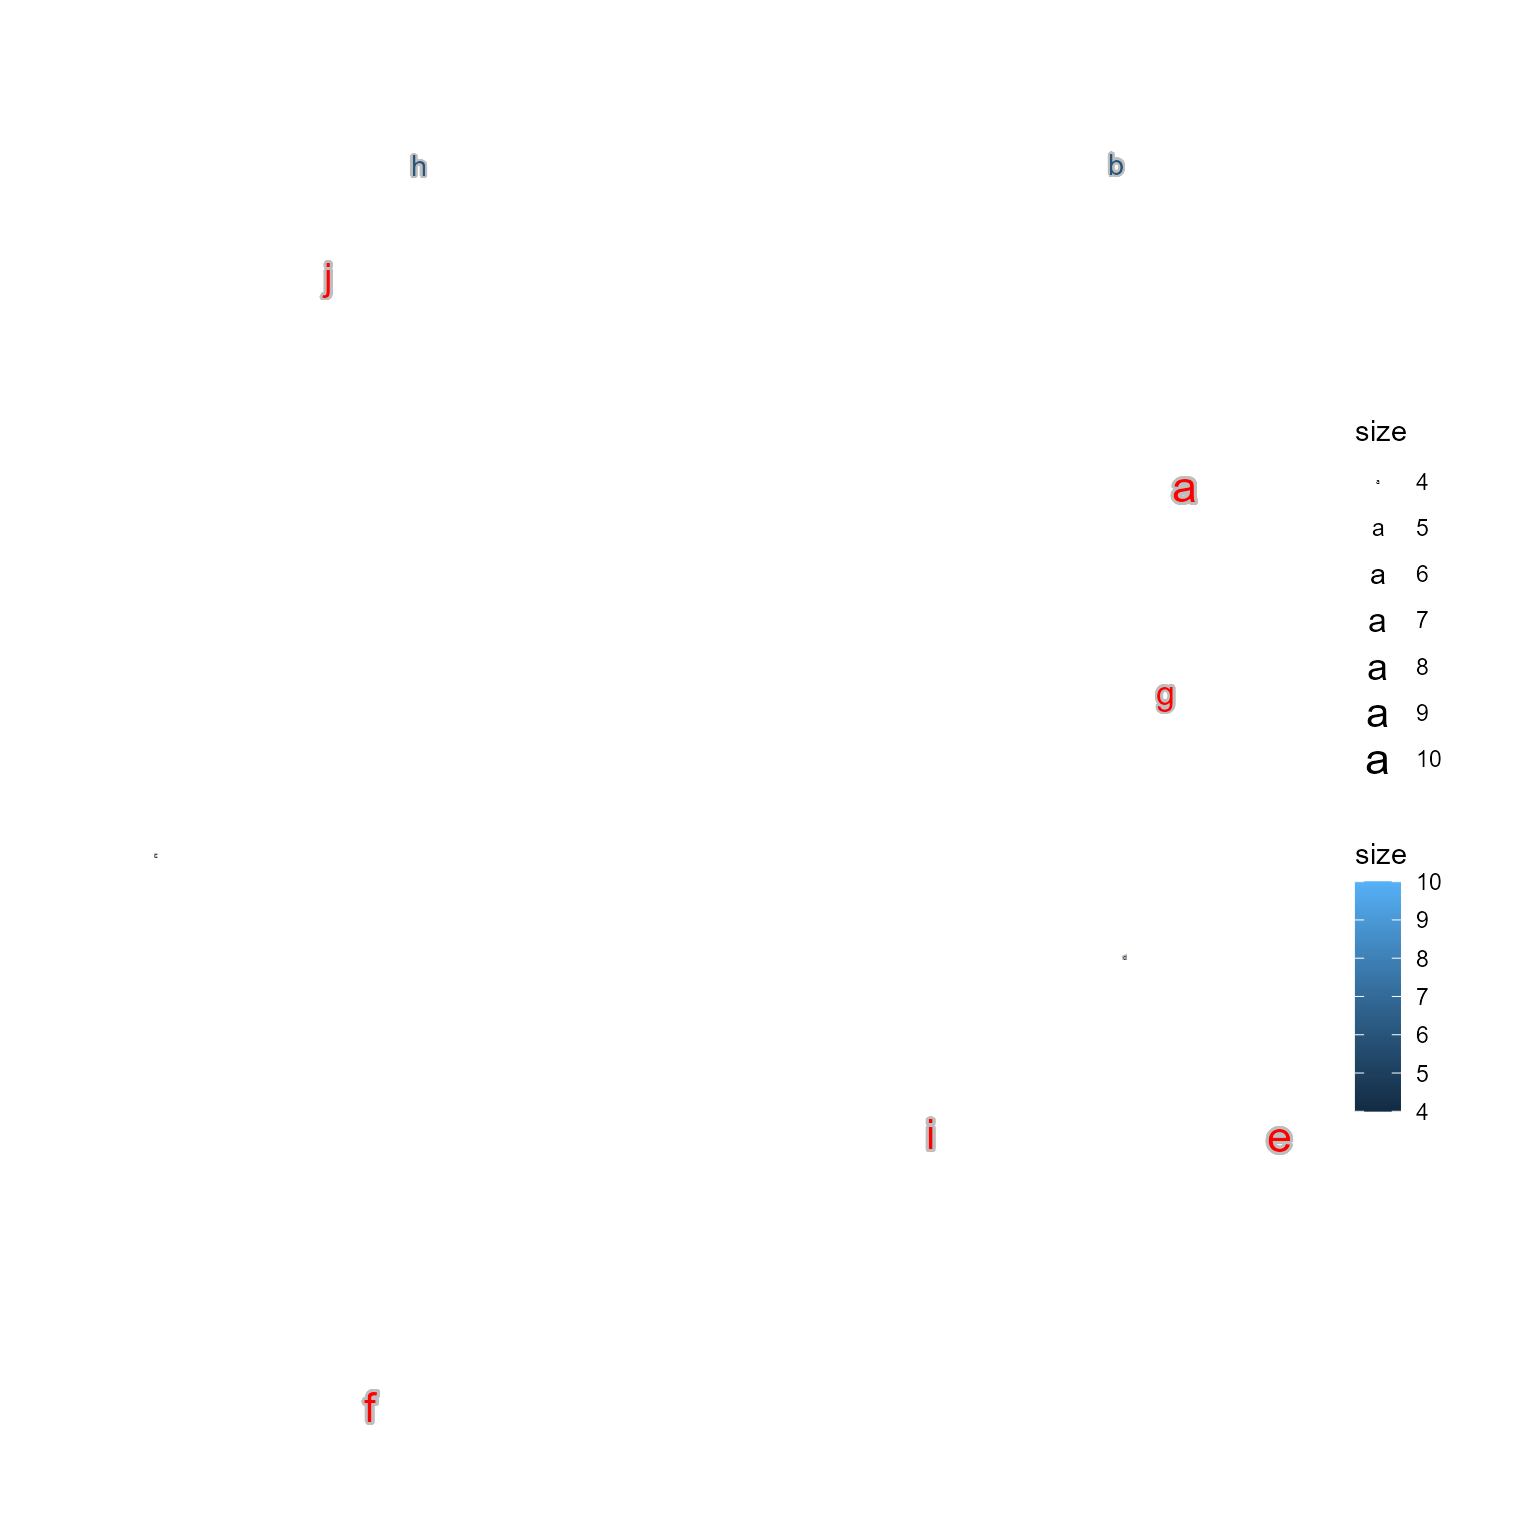
highlight_node_label
ggraph(g, layout="nicely")+
  geom_node_label(aes(label=name, color=size), repel=TRUE)+
  highlight_node_label(filter=size>5,highlight_color = "red", highlight_bg_color = "yellow")+
  theme_graph()
Combine
g <- random.graph.game(100,0.05,directed=FALSE)
E(g)$weight <- sample(1:10, length(E(g)), replace=TRUE)
V(g)$size <- sample(1:10, length(V(g)), replace=TRUE)
V(g)$size <- sample(1:10, length(V(g)), replace=TRUE)

ggraph(g, layout="circle") +
  geom_node_point(aes(size=size, color=size))+
  scale_color_viridis()+
  geom_edge_diagonal(aes(color=weight))+
  scale_edge_color_viridis(guide="none")+
  highlight_node(filter=size>0,glow=TRUE,glow_base_size = TRUE)+
  highlight_edge(filter=weight>0,glow=TRUE,glow_base_size = TRUE)+
  theme_graph()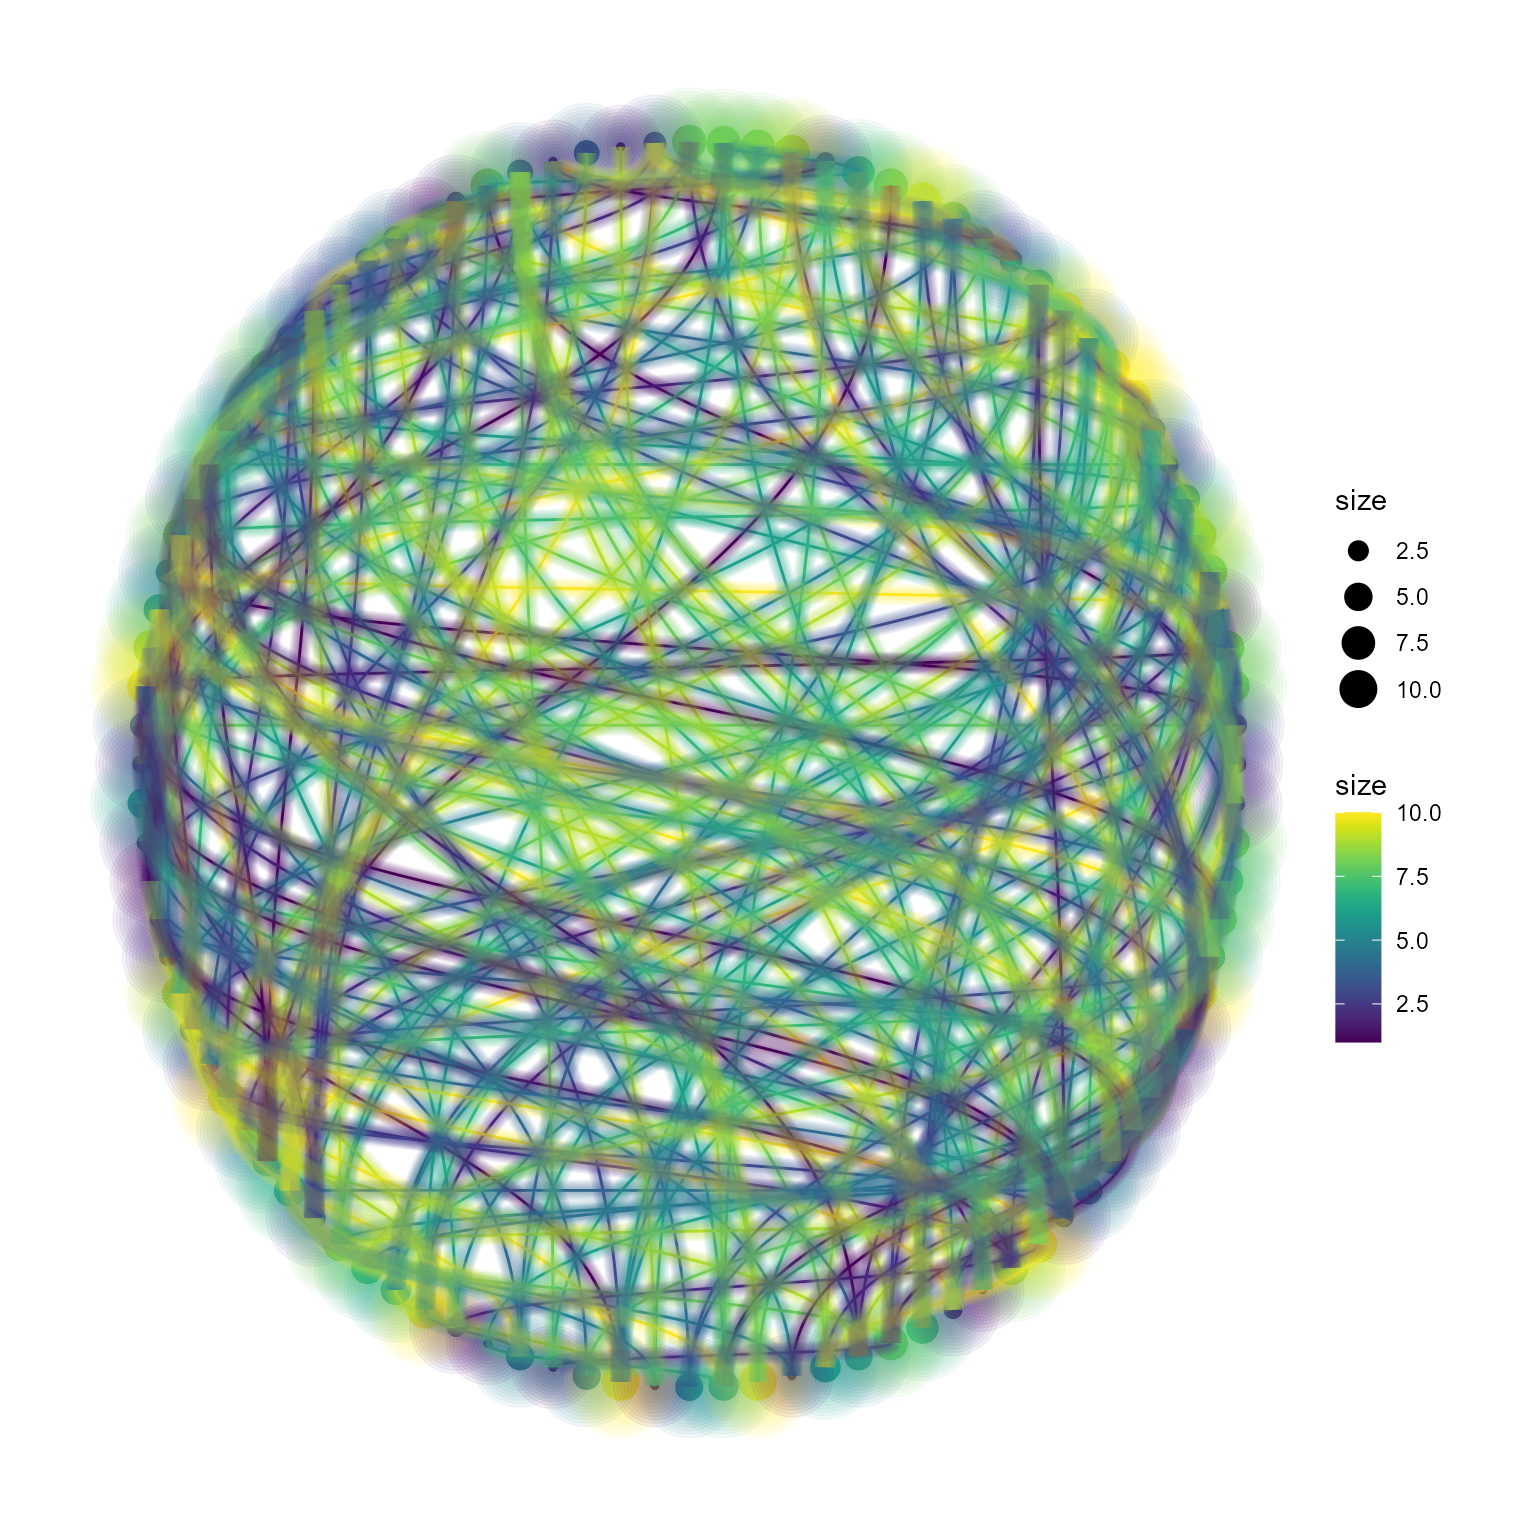
set.seed(42)
g <- sample_forestfire(nodes = 200, fw.prob = 0.01)
E(g)$weight <- sample(seq(0.1, 100, 0.1),
  length(E(g)), replace=TRUE)
V(g)$size <- sample(seq(0.1, 100, 0.1),
  length(V(g)), replace=TRUE)
V(g)$name <- unlist(strsplit(gsub(" ","",
  stringi::stri_rand_lipsum(1)), ""))[1:length(V(g))]

ggraph(g, layout="kk") +
  geom_edge_diagonal(aes(color=weight, width=weight))+
  scale_edge_width(range=c(0.1,1))+
  scale_edge_color_viridis(option="C", guide="none")+
  highlight_edge(filter=weight>50, highlight_color = NULL,
                 use_ggfx="with_outer_glow",
                 ggfx_params = list(colour="red",expand=1))+
  geom_node_point(aes(color=size, size=size))+
  highlight_node(filter=size<50, use_ggfx="with_outer_glow",
                 ggfx_params = list(colour="white",expand=2.5))+
  ## Above code is same as stacking the layer:
  ## with_outer_glow(geom_node_point(aes(filter=size<50)),
  ##                 colour="white", expand=2.5)+
  highlight_node(filter=size>70, with_text="Lorem ipsum dolor sit amet",
                 textpath_params=list(color = "white",
                                      text_only=TRUE,
                                      size=2))+
  highlight_node(filter=size>50, glow=TRUE, glow_base_size = TRUE)+
  scale_color_viridis(option="B")+
  coord_fixed()+
  theme_graph()+
  theme(panel.background = element_rect(fill = 'black'))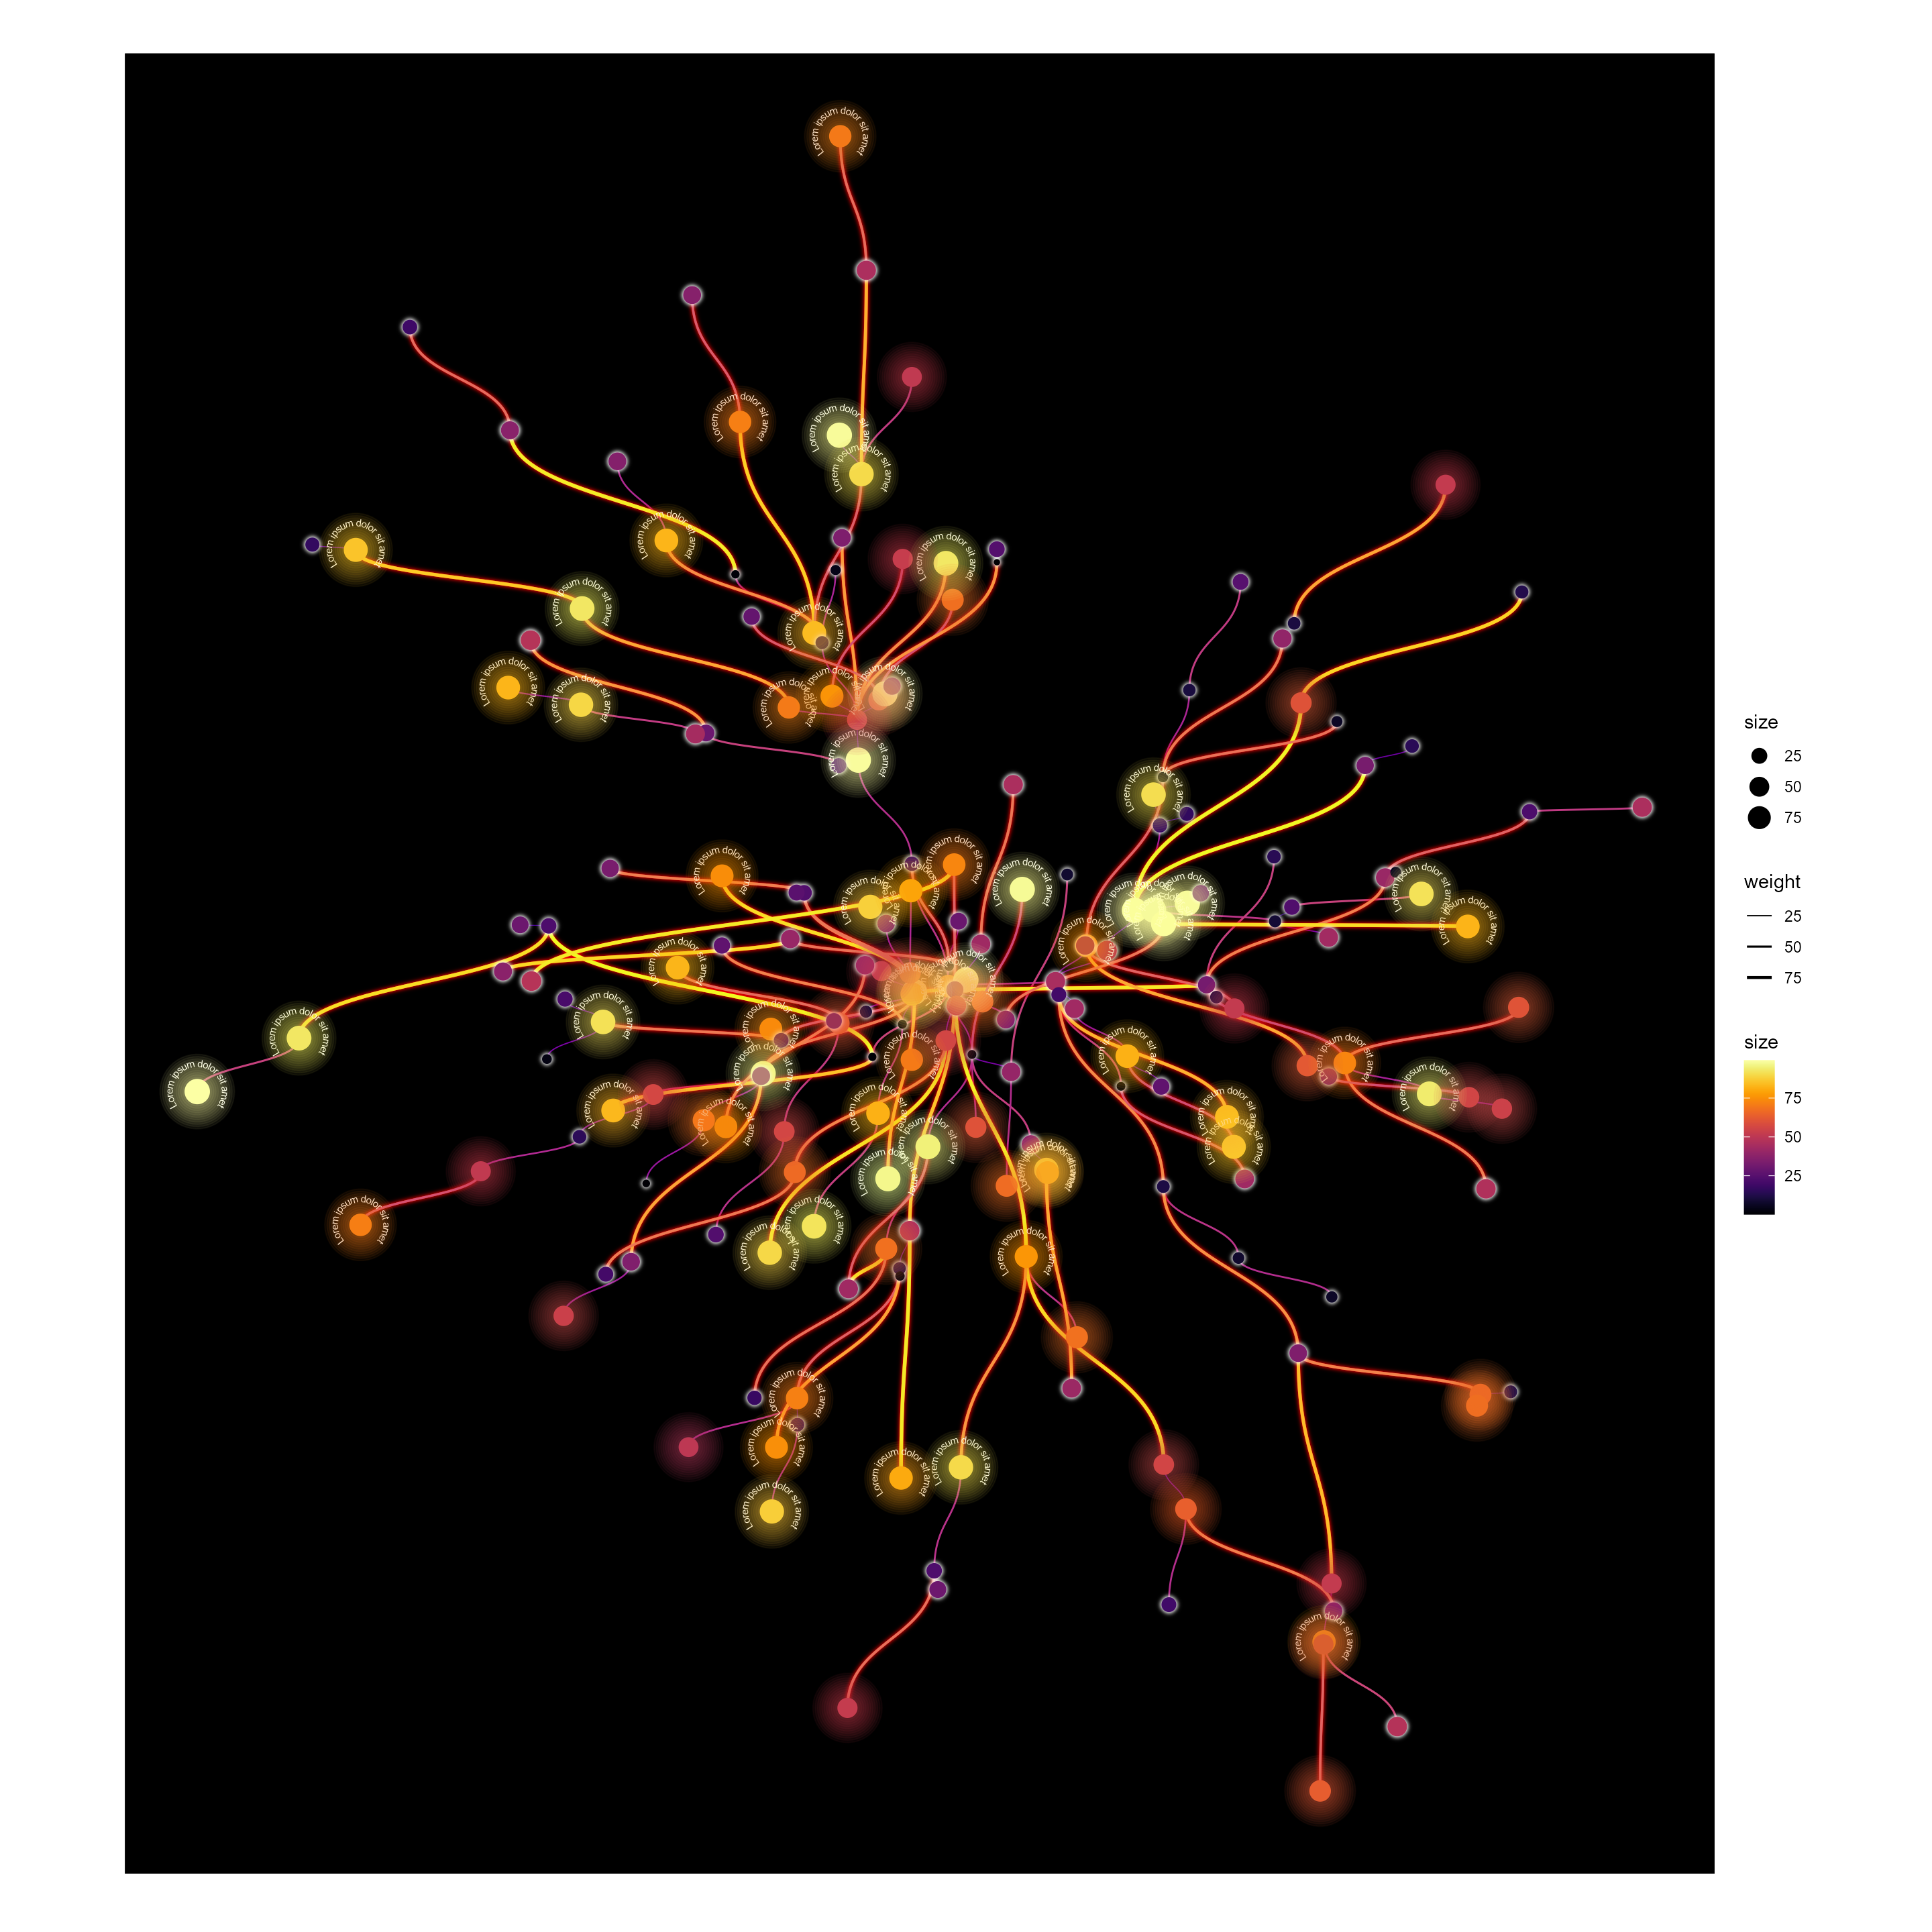
## R version 4.2.1 (2022-06-23 ucrt)
## Platform: x86_64-w64-mingw32/x64 (64-bit)
## Running under: Windows 10 x64 (build 22621)
##
## Matrix products: default
##
## locale:
## [1] LC_COLLATE=Japanese_Japan.utf8  LC_CTYPE=Japanese_Japan.utf8
## [3] LC_MONETARY=Japanese_Japan.utf8 LC_NUMERIC=C
## [5] LC_TIME=Japanese_Japan.utf8
##
## attached base packages:
## [1] stats     graphics  grDevices utils     datasets  methods   base
##
## other attached packages:
## [1] geomtextpath_0.1.1   ggfx_1.0.1           graphhighlight_0.1.0
## [4] igraph_1.4.1         ggraph_2.1.0         ggplot2_3.4.1
##
## loaded via a namespace (and not attached):
##  [1] ggrepel_0.9.3      Rcpp_1.0.9         tidyr_1.3.0        rprojroot_2.0.3
##  [5] digest_0.6.29      utf8_1.2.3         ggforce_0.4.1      R6_2.5.1
##  [9] evaluate_0.20      highr_0.10         pillar_1.9.0       rlang_1.1.0
## [13] rstudioapi_0.14    jquerylib_0.1.4    magick_2.7.4       rmarkdown_2.21
## [17] pkgdown_2.0.7      textshaping_0.3.6  desc_1.4.2         labeling_0.4.2
## [21] stringr_1.5.0      polyclip_1.10-4    munsell_0.5.0      compiler_4.2.1
## [25] xfun_0.38          pkgconfig_2.0.3    systemfonts_1.0.4  htmltools_0.5.5
## [29] tidyselect_1.2.0   tibble_3.2.1       gridExtra_2.3      graphlayouts_0.8.4
## [33] fansi_1.0.4        viridisLite_0.4.1  dplyr_1.1.1        withr_2.5.0
## [37] MASS_7.3-57        grid_4.2.1         jsonlite_1.8.0     gtable_0.3.3
## [41] lifecycle_1.0.3    magrittr_2.0.3     scales_1.2.1       cli_3.5.0
## [45] stringi_1.7.8      cachem_1.0.6       farver_2.1.1       viridis_0.6.2
## [49] fs_1.5.2           bslib_0.4.2        ragg_1.2.5         generics_0.1.3
## [53] vctrs_0.6.1        tools_4.2.1        glue_1.6.2         tweenr_2.0.2
## [57] purrr_1.0.1        shadowtext_0.1.2   fastmap_1.1.0      yaml_2.3.5
## [61] colorspace_2.1-0   tidygraph_1.2.3    memoise_2.0.1      knitr_1.42
## [65] sass_0.4.5