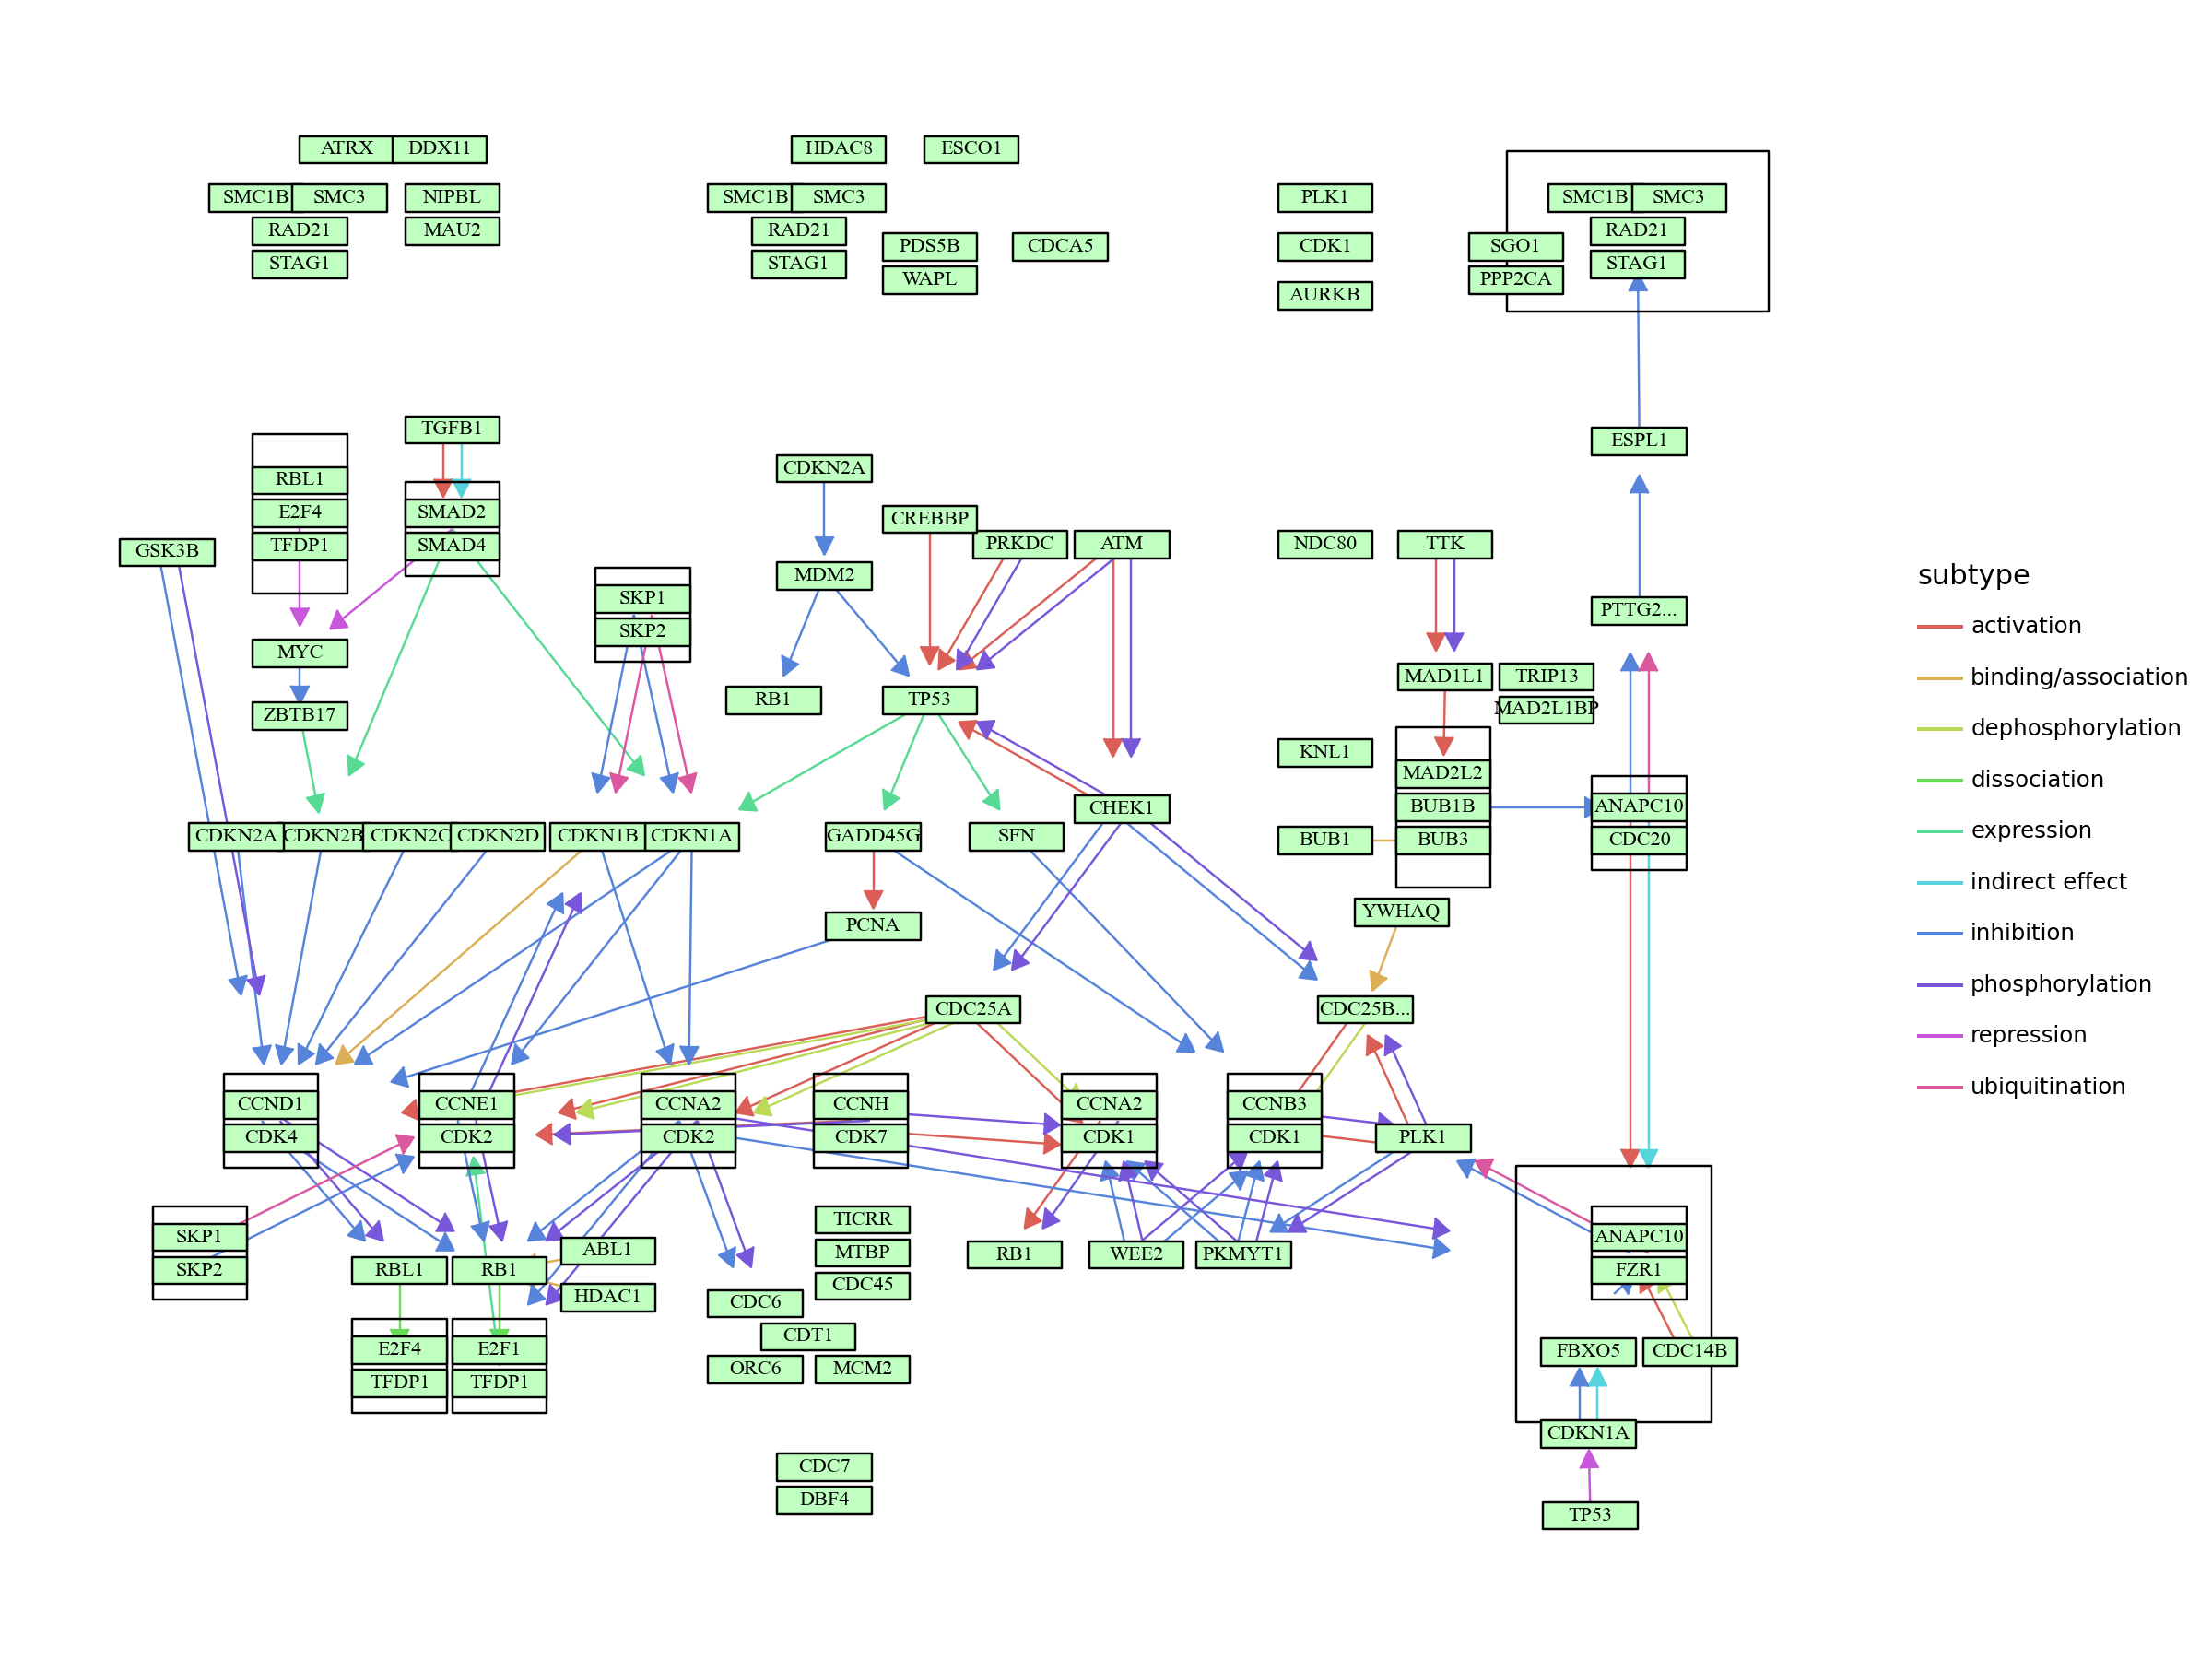
Visualization of parallel edges using plotnine
As some relationship involves multiple attributes (e.g., activation and phosphorylation), depicting multiple edges are desiable. Two functions are prepared for this purpose, outlined below.
[8]:
import pykegg
import pandas as pd
import matplotlib
import warnings
warnings.filterwarnings('ignore')
[9]:
import requests_cache

## Cache all the downloaded
requests_cache.install_cache('pykegg_cache')
[15]:
graph = pykegg.KGML_graph(pid = "hsa04110")
[16]:
## Return segments
seg_df = pykegg.return_segments(graph)
[17]:
## Edge position nudge
seg_df = pykegg.parallel_edges2(seg_df) # or, pykegg.parallel_edges()
[18]:
## Select shown subtype
seg_df["subtype"] = seg_df.subtypes.apply(lambda x: x[0][0])
[21]:
## Shorten lines
seg_df = seg_df.apply(lambda x: pykegg.shorten_end(x), axis=1)
[22]:
node_df = graph.get_nodes(node_x_nudge=20,node_y_nudge=10)
node_df["graphics_name_sp"] = node_df.graphics_name.apply(lambda x: x.split(",")[0])
[25]:
from plotnine import (
    ggplot,
    options,
    geom_point,
    geoms,
    aes,
    geom_segment,
    theme_void,
    geom_rect,
    geom_text,
)

options.figure_size = (12, 9)
plot = (
        ggplot()
        + geom_segment(
            aes(x="x", y="y", xend="xend", yend="yend", color="subtype"),
            data=seg_df,
            arrow=geoms.arrow(type="closed", length=0.05)
        )
        + geom_rect(
            aes(xmin="xmin", ymin="ymin", xmax="xmax", ymax="ymax"),
            data=node_df[node_df.original_type == "group"],
            color="black", alpha=0, fill="#ffffff"
            )
        + geom_rect(
            aes(xmin="xmin", ymin="ymin", xmax="xmax", ymax="ymax"),
            data=node_df[node_df.original_type == "gene"],
            color="black",
            fill=node_df[node_df.original_type == "gene"].bgcolor)
           +geom_text(
             aes(x="x",y="y", label="graphics_name_sp"),
               family="serif", size=8,
            data=node_df[node_df.original_type == "gene"],
            color="black"
           )
    )+theme_void()
[26]:
plot

[26]:
<Figure Size: (1200 x 900)>